. 2013 Mar 11;210(3):491-502.
doi: 10.1084/jem.20122006. Epub 2013 Mar 4.

IL-1 enhances expansion, effector function, tissue localization, and memory response of antigen-specific CD8 T cells

Affiliations

IL-1 enhances expansion, effector function, tissue localization, and memory response of antigen-specific CD8 T cells

Shlomo Z Ben-Sasson et al. J Exp Med. .

Abstract

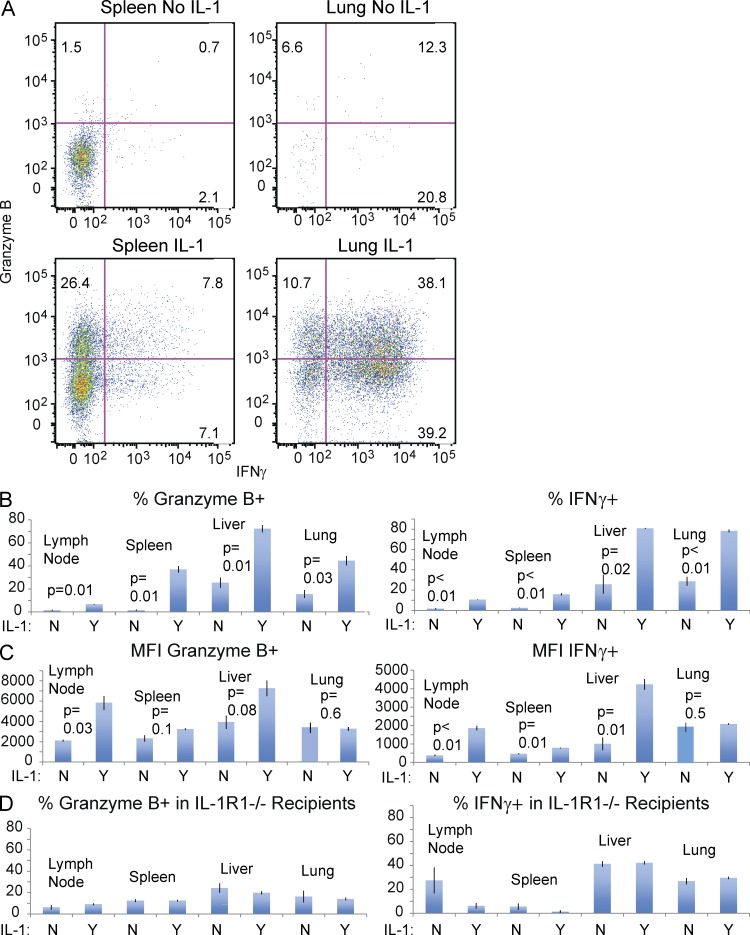
Here, we show that interleukin-1 (IL-1) enhances antigen-driven CD8 T cell responses. When administered to recipients of OT-I T cell receptor transgenic CD8 T cells specific for an ovalbumin (OVA) peptide, IL-1 results in an increase in the numbers of wild-type but not IL1R1(-/-) OT-I cells, particularly in spleen, liver, and lung, upon immunization with OVA and lipopolysaccharide. IL-1 administration also results in an enhancement in the frequency of antigen-specific cells that are granzyme B(+), have cytotoxic activity, and/ or produce interferon γ (IFN-γ). Cells primed in the presence of IL-1 display enhanced expression of granzyme B and increased capacity to produce IFN-γ when rechallenged 2 mo after priming. In three in vivo models, IL-1 enhances the protective value of weak immunogens. Thus, IL-1 has a marked enhancing effect on antigen-specific CD8 T cell expansion, differentiation, migration to the periphery, and memory.


Figures

Figure 1.
Figure 1.
IL-1 enhances antigen-driven CD8 T cell responses. (A) 104 OT-I cells were injected into UBC-GFP C57BL/6 mice. Mice were immunized subcutaneously with LPS with or without IL-1β. 7 d after priming, the frequency of splenic GFP CD8+ OT-I cells was determined. Results are presented as the percentage of cells in total splenic lymphocytes. (B) 1–3 × 10⁴ OT-I cells were injected into UBC-GFP, CD45.1, or CD90.1 C57BL/6 mice. Mice were immunized with OVA plus LPS with or without IL-1. 7 d after priming, the percentage and total number of transferred OT-I cells in the organs was determined. Data are the mean ratios of the number of OT-I cells in mice immunized with OVA plus LPS plus IL-1 compared with that in mice immunized with OVA plus LPS from nine experiments. (C) 104 CD45.1 OT-I and 104 CD45.1 OT-II cells were injected into CD45.2 IL-1R1−/− and wild-type CD45.2 C57BL/6 mice. Mice were immunized with OVA plus LPS with or without IL-1. 7 d after priming, cells were analyzed for number of OT-I cells. This experiment was performed three times with similar results.
Figure 2.
Figure 2.
IL-1 enhancement of CD8 responses does not depend on CD4 cells. (A) 4 × 10⁵ OT-I cells were injected into Rag1−/− C57BL/6 mice. Mice were immunized with OVA and LPS with or without IL-1. 7 d after priming, the number of transferred OT-I cells was determined. This experiment was performed twice with similar results. (B) 3 × 10⁴ OT-I cells with or without 3 × 10⁴ OT-II cells were injected into IL-1R1−/− C57BL/6 mice that were immunized with OVA, LPS with or without IL-1. 7 d after priming, the number of OT-I cells was measured. This experiment was performed twice with similar results.
Figure 3.
Figure 3.
IL-1 increases the frequency of OT-I cells in liver and lung. (A) 104 OT-I cells were injected into UBC-GFP C57BL/6 mice. Mice were immunized with OVA and LPS with or without IL-1. 7 d after priming, lymphocyte-enriched fractions were isolated from liver and lung and cells were analyzed for proportion of OT-I cells. This experiment was performed six times with similar results. (B) 104 OT-I cells were injected into UBC-GFP C57BL/6 mice that were then immunized with OVA and LPS with or without IL-1. 7 d after priming, lymphocyte-enriched fractions were isolated from liver and lung and number of OT-I cells was measured. This experiment was performed four times with similar results. (C) 1–3 × 10⁴ OT-I cells were injected into UBC-GFP CD45.1, CD90.1 C57BL/6, CD45.1 C57BL/6, or IL-1R1−/− C57BL/6 mice. Recipients were immunized with OVA plus LPS. 7 d later, the percentage of transferred OT-I cells among the CD8 population in lymph nodes, spleen, liver, and lung was determined. The mean ratio of the percentage of OT-I in CD8 in liver, lung, and spleen compared with that of the lymph nodes from five experiments in WT mice (red) and from three experiments in IL-1R1−/− recipients (green) were calculated. In addition, in one experiment (blue), 106 OT-I cells were transferred without immunization and the ratio of the percentage of OT-I in CD8 in liver, lung, and spleen compared with that of the lymph nodes was determined. (D) 104 CD45.1 OT-I and 104 CD45.1 OT-II cells were injected into CD45.2 IL-1R1−/− and wild-type C57BL/6 mice. Mice were immunized with OVA and LPS with or without IL-1. 7 d after priming, single-cell suspensions from the lymph nodes, spleen, liver, and lung were analyzed by FACS for the content of OT-I cells. The ratio of the number of OT-I cells in the presence of IL-1 to that in its absence is plotted. This experiment was performed twice with similar results.
Figure 4.
Figure 4.
IL-1 enhances CD8 T cell differentiation. (A) 104 OT-I and 104 OT-II cells were injected into UBC-GFP C57BL/6 mice. Mice were immunized with OVA and LPS with or without IL-1. 7 d after priming, cells from the lymph nodes, spleen, liver, and lung were stimulated for 4 h with PMA and ionomycin, and the percentage of granzyme B+ cells and IFN-γ+ cells among the OT-I cells was determined. This experiment was performed four times with similar results. (B) 104 OT-I and 104 OT-II cells were injected into UBC-GFP C57BL/6 mice. 6 d later, the mice were immunized with OVA and LPS with or without IL-1. 7 d after priming, cells from the lymph nodes, spleen, liver, and lung were stimulated for 4 h with PMA and ionomycin. The percentage of granzyme B+ cells and IFN-γ+ cells among the CD8+ GFP OT-I cells in the various organs was determined. This experiment was performed five times with similar results. (C) The MFI of granzyme B and IFN-γ among positive cells in the various organs was determined by FACS analysis. This experiment was performed four times with similar results. (D) 104 CD45.1 OT-I and 104 CD45.1 OT-II cells were injected into CD45.2 IL-1R1−/− C57BL/6 mice. Mice were immunized with OVA and LPS with or without IL-1. 7 d after immunization, cells from the lymph nodes, spleen, liver, and lung were stimulated for 4 h with PMA and ionomycin. The percentage of granzyme B+ cells and IFN-γ+ cells among the OT-I cells was measured. There were no statistically significant differences in values obtained in mice that did and did not receive IL-1. This experiment was performed twice with similar results.
Figure 5.
Figure 5.
IL-1 increases cytotoxic activity in vivo. (A) OT-I mice were primed in vivo with OVA and LPS with or without IL-1 (3 daily s.c. injections on days 1, 3, and 5 after immunization). 9 d later, 7.6 × 10⁵, 1.2 × 10⁵, or 0.2 × 10⁵ cells from the immunized mice were transferred to C57BL/6 mice. 7 d after the OT-I transfer, recipient mice were injected with 3 × 10⁶ SIINFEKL-loaded CFSEhigh and 1.4 × 10⁶ control CFSElow syngeneic splenocytes. 18 h later, lymph nodes were removed and the percentage of SIINFEKL-loaded cells among the CFSE-labeled population was determined. This experiment was performed twice with similar results. (B) C57BL/6 mice were immunized with OVA and LPS with or without IL-1. 8 d later, the percentage of SINFEKL tetramer-binding cells among the CD8 population in the lymph nodes and spleen was determined. This experiment was performed three times with similar results. (C) C57BL/6 mice were immunized with OVA and LPS with or without IL-1. 7 d after priming, recipient mice were injected with 4 × 10⁶ SIINFEKL-loaded CFSEhigh and 2 × 10⁶ control CFSElow syngeneic splenocytes. 18 h later, the percentage of SIINFEKL-loaded cells among the CFSE labeled population of lymph node and spleen was determined. This experiment was performed three times with similar results.
Figure 6.
Figure 6.
OT-I cells primed in the presence of IL-1 retain their phenotype upon boost 8 wk later. 104 OT-I and 104 OT-II cells were injected i.p. into UBC-GFP C57BL/6 mice. 6 d later, the mice were immunized with OVA and LPS with or without IL-1. 8 wk after priming, the mice were boosted with OVA and LPS. Three days later, cells from liver and lung were stimulated for 4 h with PMA and ionomycin. The percentage of granzyme B+ and IFN-γ+ cells among the OT-I cells in a representative animal is shown in A and summary cell number and percent of granzyme B+ and IFN-γ+ cells are shown in B and C. This experiment was performed three times with similar results.
Figure 7.
Figure 7.
IL-1 effect on protective responses to L. monocytogenes, recombinant vaccinia, and a tumor line. (A) C57BL/6 mice were either untreated, inoculated with 500 live L. monocytogenes (Lm), the equivalent of heat-killed L. monocytogenes (HKLM), or HKLM and IL-1 (10 µg delivered over 7 d in a mini-osmotic pump). 29 d later, the mice were challenged with 5 × 10⁴ CFU of live Lm. Bacterial CFU in liver were enumerated 3 d later. This experiment was performed three times with similar results. (B) BALB/c mice were immunized twice with 100 µg of the HIV-1 peptide RGPGRAFVTI, 10 d apart, alone, with IL-1, or with a cocktail of TLR ligands, and then infected i.p. with 2 × 10⁷ recombinant vaccinia virus (vPE16) 1 wk after the last immunization. 6 d after infection, viral load in the ovaries was determined by a plaque assay using BSC-1 cells. This experiment was repeated five times with similar results. (C) TC1 cells were injected s.c. into the flank of C57BL/6 mice. 14 d later, when the tumor was measurable, mice were immunized with a vaccine containing the HPV16 E749-57 peptide with 20 µg DOTAP and 25 µg LPS with or without IL-1 (2 µg on days 0, 1, 2, and 4). Each group contained 3–5 mice. P-values were calculated using the Mann-Whitney test. This experiment was repeated twice with similar results. **, P = 0.02; *, P = 0.03.

References

    1. Ben-Sasson S.Z., Hu-Li J., Quiel J., Cauchetaux S., Ratner M., Shapira I., Dinarello C.A., Paul W.E. 2009. IL-1 acts directly on CD4 T cells to enhance their antigen-driven expansion and differentiation. Proc. Natl. Acad. Sci. USA. 106:7119–7124 10.1073/pnas.0902745106 - DOI - PMC - PubMed
    1. Bonilla W.V., Fröhlich A., Senn K., Kallert S., Fernandez M., Johnson S., Kreutzfeldt M., Hegazy A.N., Schrick C., Fallon P.G., et al. 2012. The alarmin interleukin-33 drives protective antiviral CD8+ T cell responses. Science. 335:984–989 10.1126/science.1215418 - DOI - PubMed
    1. Chi H. 2012. Regulation and function of mTOR signalling in T cell fate decisions. Nat. Rev. Immunol. 12:325–338 - PMC - PubMed
    1. Curtsinger J.M., Schmidt C.S., Mondino A., Lins D.C., Kedl R.M., Jenkins M.K., Mescher M.F. 1999. Inflammatory cytokines provide a third signal for activation of naive CD4+ and CD8+ T cells. J. Immunol. 162:3256–3262 - PubMed
    1. Ding Z., Xiong K., Issekutz T.B. 2000. Regulation of chemokine-induced transendothelial migration of T lymphocytes by endothelial activation: differential effects on naive and memory T cells. J. Leukoc. Biol. 67:825–833 - PubMed

Publication types