. 2013 Mar 11;210(3):475-89.
doi: 10.1084/jem.20121088. Epub 2013 Mar 4.

BATF is required for normal expression of gut-homing receptors by T helper cells in response to retinoic acid

Affiliations

BATF is required for normal expression of gut-homing receptors by T helper cells in response to retinoic acid

Chuanwu Wang et al. J Exp Med. .

Abstract

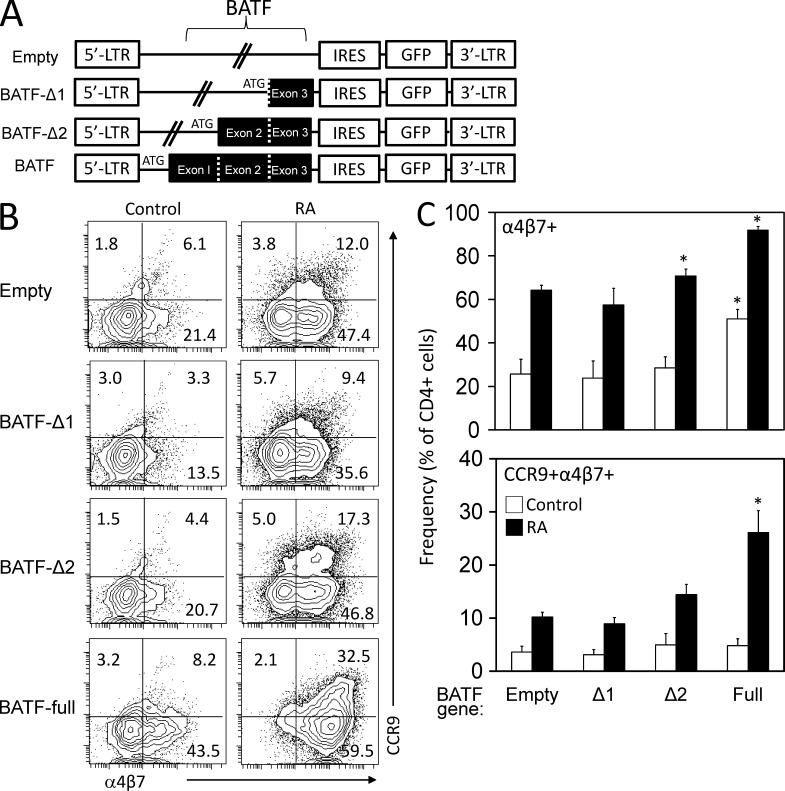
CCR9 and α4β7 are the major trafficking receptors for lymphocyte migration to the gut, and their expression is induced during lymphocyte activation under the influence of retinoic acid (RA). We report here that BATF (basic leucine zipper transcription factor, ATF-like), an AP-1 protein family factor, is required for optimal expression of CCR9 and α4β7 by T helper cells. BATF-deficient (knockout [KO]) mice had reduced numbers of effector T and regulatory T cells in the intestine. The intestinal T cells in BATF KO mice expressed CCR9 and α4β7 at abnormally low levels compared with their wild-type (WT) counterparts, and BATF KO CD4(+) T cells failed to up-regulate the expression of CCR9 and α4β7 to WT levels in response to RA. Defective binding of RARα and histone acetylation at the regulatory regions of the CCR9 and Itg-α4 genes were observed in BATF KO T cells. As a result, BATF KO effector and FoxP3(+) T cells failed to populate the intestine, and neither population functioned normally in the induction and regulation of colitis. Our results establish BATF as a cellular factor required for normal expression of CCR9 and α4β7 and for the homeostasis and effector functions of T cell populations in the intestine.


Figures

Figure 1.
Figure 1.
BATF KO mice are deficient with T cells in the intestine. (A) CD4 and CD8 cells in the small intestinal villi of WT and BATF KO mice were examined by immunohistochemistry. Bars, 50 µm. (B) CD4+ FoxP3 effector, CD4+ FoxP3+ regulatory, and CD8+ T cells in selected organs were analyzed by flow cytometry. (C) Absolute numbers of each cell population in the indicated organs. Representative (A and B) and pooled (C) data obtained from four experiments using 6–8-wk-old mice are shown. All error bars are SEM obtained from pooled data. Significant differences from WT T cells are shown (*, P < 0.05).
Figure 2.
Figure 2.
BATF KO gut T cells are deficient in expression of CCR9 and α4β7. (A) Expression of the indicated trafficking receptors by CD4+ FoxP3+/− T cell subsets were analyzed by flow cytometry. (B) Graphs show absolute cell numbers. (C) Expression of CCR9 and α4β7 by CD8+ T cells. Graphs show frequencies of CCR9+ or α4β7+ CD8+ T cells in the indicated organs. Representative (A) and pooled (n = 8–11 for B; n = 5 for C) data obtained from at least five experiments using 6–8-wk-old mice are shown. All error bars are SEM obtained from pooled data. Significant differences between WT and BATF KO T cells are shown (*, P < 0.05).
Figure 3.
Figure 3.
BATF KO T cells are defective in up-regulation of CCR9 and α4β7 but not in becoming FoxP3+ T cells in response to RA. (A) CD4+ naive T cells were activated in the presence of RA, and expression of CCR9 and α4β7 was examined by flow cytometry. (B) Expression of the trafficking receptor genes at the mRNA by cultured CD4+ naive T cells was examined by quantitative RT-PCR. Normalized values to β-actin levels are shown. (C) Expression of other chemokine receptors was examined by flow cytometry. (D) RA-dependent induction of FoxP3+ T cells in vitro from naive CD4+ T cells was examined by flow cytometry. Naive CD4+ T cells were in vitro activated with concanavalin A and IL-2 in the presence or absence of 10 nM RA for 5 d. 1 ng/ml TGFβ1 was added to culture. (E) Expression of CCR9 and α4β7 by WT and BATF KO FoxP3+ cells induced by RA and TGFβ1. All graphs show pooled data obtained from four experiments (*, P < 0.05). All error bars are SEM obtained from pooled data.
Figure 4.
Figure 4.
Enforced BATF expression restores the gut-homing receptor deficiency of BATF KO T cells. (A) Retroviral vectors expressing the full-length and truncated versions of BATF were constructed. BATF-deficient T cells were infected by retroviral vectors expressing the full-length or truncated BATF genes. (B and C) Expression of CCR9 and α4β7 was determined by flow cytometry 4 d after infection, and the data are shown as dot plots (B) and graphs (C). The graphs show combined data from three experiments. All error bars are SEM obtained from pooled data. Significant differences from the control groups are shown (*, P < 0.05).
Figure 5.
Figure 5.
RARα fails to bind the 5′ regulatory regions of the mouse CCR9 and Itg-α4 genes in BATF deficiency. WT or BATF KO CD4+ T cells were activated for 4–5 d with concanavalin A, IL-2, and RA. (A) Expression of nuclear RAR genes in BATF KO CD4+ T cells was examined by quantitative RT-PCR. Normalized values to β-actin levels are shown. (B and C) The binding of RARα and BATF and histone H4 acetylation on the CCR9 gene (B) or the Itg-α4 gene (C) were assessed by ChIP assay. Representative PCR data with duplicated measurements are shown. (D) WT or BATF KO CD4+ T cells were activated for 4–5 d with anti-CD3/CD28 in the presence of IL-2 and 10 nM RA and transfected with pGL4-5′-Itg-α4. The cells were reactivated with anti-CD3/28 + IL2 in the presence of 20 nM RA for 16 h, and luciferase activity was normalized to control Renilla luciferase activity. (E) Naive WT or BATF KO CD4+ T cells were activated with anti-CD3/CD28 or concanavalin A for 4–5 d in the presence of IL-2 and 10 nM RA and the indicated HDAC inhibitors (TSA, BML-210, or EX-527), and the expression of CCR9 and α4β7 was measured by flow cytometry. Graphs show the percentage of cells expressing CCR9 or α4β7. All of the experiments were performed at least three times, and pooled (A, D, and E) or representative (B and C) data are shown. Error bars are SEM obtained from pooled data (A, D, and E) or differences between duplicated measurements (B and C). Significant differences from the KO control group are shown (*, P < 0.05).
Figure 6.
Figure 6.
Defective migration of BATF KO CD4+ T cells into the intestine. (A) WT and BATF KO CD4+ T cells were activated with RA for 5 d and then added to the upper chamber in a Transwell assay. 3 µg/ml CCL25 was added to the lower chamber, and the cells in the lower chamber were counted after 3 h. The data are shown as percent net migration after normalization to input cells and subtraction of the background migration rates. (B) WT and BATF KO CD4+ T cells were activated for 5–6 d with concanavalin A, IL-2, and RA and were then differentially labeled with CFSE and TRITC. The cells were mixed in a 1:1 ratio and injected i.v. into WT mice. (B and C) Numbers of cells in the indicated organs were assessed by flow cytometry (B) or confocal microscopy (C) after 20 h. Bars, 50 µm. (B) The homing index indicates the frequency of KO cells relative to WT cells. (D) The tissues were examined also with multiphoton microscopy. Pooled data from three experiments are shown in A and B. Pooled data from multiple images (3–12) obtained from two independent experiments are shown in C and D. All error bars are SEM obtained from pooled data. Significant differences between WT and BATF KO T cells are shown (*, P < 0.05).
Figure 7.
Figure 7.
Defective population of CD4+ T cells in the intestine after intragastric immunization. WT and BATF KO OT-II CD4+ T cells were transferred into CD45.1+ mice, and the mice were intragastrically immunized with OVA. The mice were sacrificed 12 d later. (A) CD4+ CD45.2+ T cell subsets in the intestine and other organs were examined by flow cytometry. (B) Absolute numbers of CD4+ CD45.2+ FoxP3+ and FoxP3 CD4+ T cells in various organs are shown. Pooled data obtained from three experiments (n = 5–7/group) are shown. All error bars are SEM obtained from pooled data. Significant differences (P < 0.05) from non-OVA–treated groups (*) or WT counterparts (**) are shown.
Figure 8.
Figure 8.
BATF KO T cells are defective in inducing colitis. Rag1−/− mice were injected with the naive CD4+CD25 T cells isolated from WT or BATF KO mice. (A) Weight change after injection of WT or BATF KO naive CD4+CD25 T cells was monitored. (B) Histological changes of the intestine of Rag1−/− mice injected with naive CD4+CD25 T cells were examined at the time of mouse termination. Bars, 200 µm. (C) Frequencies of Th1, Th17, and FoxP3+ T cells in Rag1−/− mice injected with naive CD4+CD25 T cells were determined by flow cytometry. Pooled data obtained from three experiments are shown in the graphs (n ≥ 10/group). All error bars are SEM obtained from pooled data. Significant differences between indicated groups or from WT groups are shown (*, P < 0.05).
Figure 9.
Figure 9.
BATF KO T cells are largely intact in activation, survival, and proliferation. (A–E) WT and BATF KO CD4+ T cells were examined in vitro for activation (A) and survival (B) and in vivo for proliferation (C–E). T cells were activated with anti-CD3, anti-CD28, and IL-2 for 4 d, and expression of CD69 and CD62L (A) and cell death based on staining with annexin V and propidium iodide (PI; B) were examined. (C) CD45.1 mice were injected i.v. with 10 million CFSE-labeled WT or BATF KO OT-II CD4+ T cells and were immunized i.p. with OVA in complete Freund’s adjuvant. CFSE dilution was examined by flow cytometry 5 d later. (D) Rag1−/− mice were injected i.v. with 10 million CFSE-labeled WT or BATF KO CD4+ T cells. The host mice were examined 14 d later for CFSE dilution. (E) Absolute numbers of WT and BATF KO CD4+ T cells expanded in the indicated organs of Rag1−/− mice are shown. Pooled data obtained from three experiments are shown in the graphs (n ≥ 10/group). All error bars are SEM obtained from pooled data. Significant differences from WT groups are shown (*, P < 0.05).
Figure 10.
Figure 10.
BATF KO iTreg cells, although equally suppressive in vitro as WT iTreg cells, are unable to suppress colitis. BATF KO and WT iTreg cells were prepared in vitro from naive CD4+ T cells through activation with concanavalin A in the presence of TGFβ1 and 10 nM RA for 6 d. (A) The iTreg cells were examined for their suppressive activity on proliferation of target (CD4+CD25) T cells based on frequencies (percentages) of CFSE-diluted cells determined by flow cytometry. (B–E) Rag1−/− mice were injected i.p. with 0.6 × 10⁶ WT CD45.1+ naive CD4+CD25 T cells and 1.2 × 10⁶ WT or BATF KO CD45.2+ iTreg cells, and weight change (B), histological changes on day 25–28 (C), frequencies of Th1, Th17, and FoxP3+ T cells derived from the naive CD4+CD25 T cells (D), and frequencies of FoxP3+ cells derived from the injected iTreg cells (E) were examined. Bars, 200 µm. The mice (n = 9–10/group) were sacrificed on day 25–28 after T cell transfer when some mice lost >20% of their original weight. Pooled data obtained from three experiments are shown in the graphs. All error bars are SEM obtained from pooled data. Significant differences between indicated groups or between WT and BATF KO groups are shown (*, P < 0.05).

References

    1. Abitorabi M.A., Mackay C.R., Jerome E.H., Osorio O., Butcher E.C., Erle D.J. 1996. Differential expression of homing molecules on recirculating lymphocytes from sheep gut, peripheral, and lung lymph. J. Immunol. 156:3111–3117 - PubMed
    1. Bargatze R.F., Jutila M.A., Butcher E.C. 1995. Distinct roles of L-selectin and integrins alpha 4 beta 7 and LFA-1 in lymphocyte homing to Peyer’s patch-HEV in situ: the multistep model confirmed and refined. Immunity. 3:99–108 10.1016/1074-7613(95)90162-0 - DOI - PubMed
    1. Berlin C., Bargatze R.F., Campbell J.J., von Andrian U.H., Szabo M.C., Hasslen S.R., Nelson R.D., Berg E.L., Erlandsen S.L., Butcher E.C. 1995. alpha 4 integrins mediate lymphocyte attachment and rolling under physiologic flow. Cell. 80:413–422 10.1016/0092-8674(95)90491-3 - DOI - PubMed
    1. Betz B.C., Jordan-Williams K.L., Wang C., Kang S.G., Liao J., Logan M.R., Kim C.H., Taparowsky E.J. 2010. Batf coordinates multiple aspects of B and T cell function required for normal antibody responses. J. Exp. Med. 207:933–942 10.1084/jem.20091548 - DOI - PMC - PubMed
    1. Cassani B., Villablanca E.J., Quintana F.J., Love P.E., Lacy-Hulbert A., Blaner W.S., Sparwasser T., Snapper S.B., Weiner H.L., Mora J.R. 2011. Gut-tropic T cells that express integrin α4β7 and CCR9 are required for induction of oral immune tolerance in mice. Gastroenterology. 141:2109–2118 10.1053/j.gastro.2011.09.015 - DOI - PMC - PubMed

Publication types

MeSH terms