

Micro-MRI study of cerebral aging: ex vivo detection of hippocampal subfield reorganization, microhemorrhages and amyloid plaques in mouse lemur primates
- PMID: 23460806
- PMCID: PMC3584101
- DOI: 10.1371/journal.pone.0056593
Micro-MRI study of cerebral aging: ex vivo detection of hippocampal subfield reorganization, microhemorrhages and amyloid plaques in mouse lemur primates
Abstract
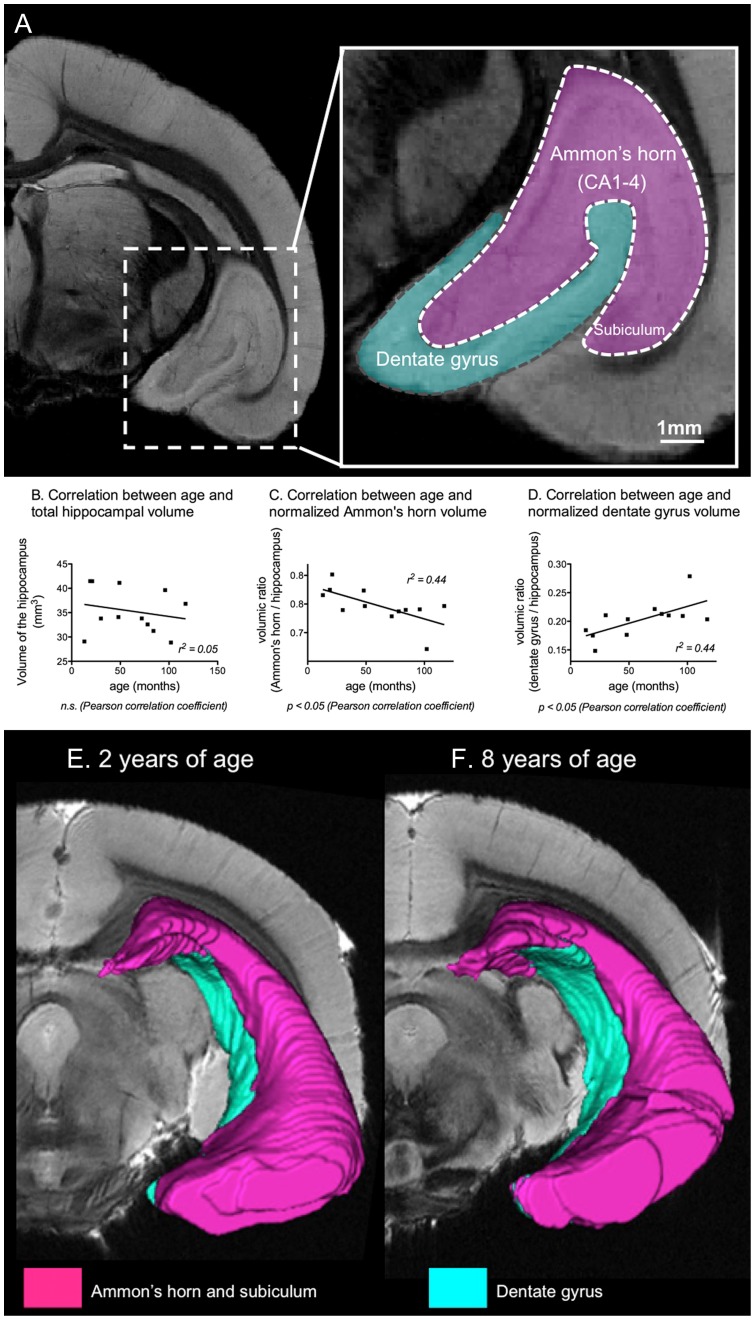
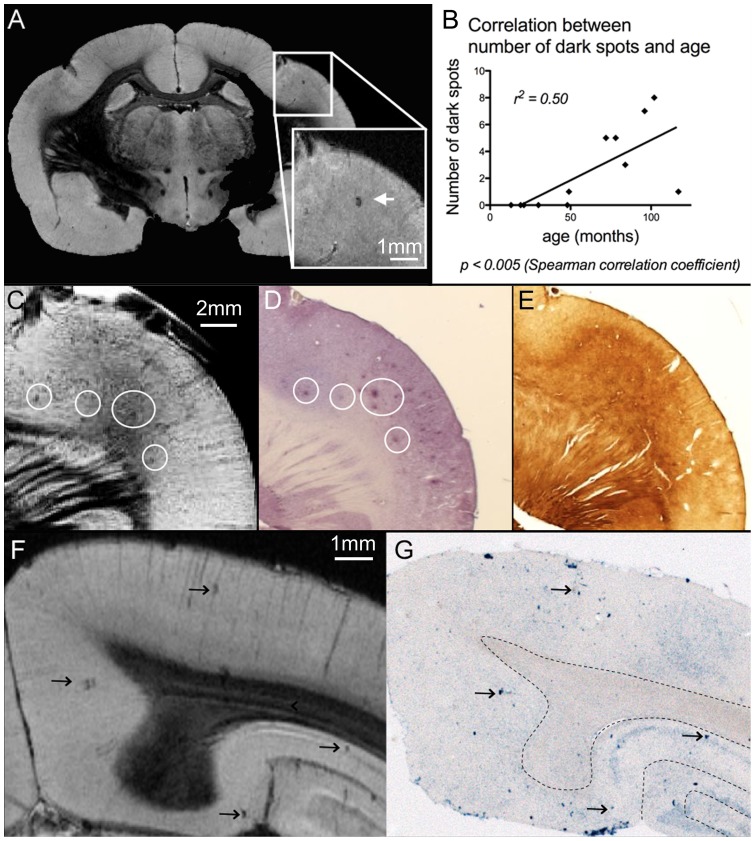
Mouse lemurs are non-human primate models of cerebral aging and neurodegeneration. Much smaller than other primates, they recapitulate numerous features of human brain aging, including progressive cerebral atrophy and correlation between regional atrophy and cognitive impairments. Characterization of brain atrophy in mouse lemurs has been done by MRI measures of regional CSF volume and by MRI measures of regional atrophy. Here, we further characterize mouse lemur brain aging using ex vivo MR microscopy (31 µm in-plane resolution). First, we performed a non-biased, direct volumetric quantification of dentate gyrus and extended Ammon's horn. We show that both dentate gyrus and Ammon's horn undergo an age-related reorganization leading to a growth of the dentate gyrus and an atrophy of the Ammon's horn, even in the absence of global hippocampal atrophy. Second, on these first MR microscopic images of the mouse lemur brain, we depicted cortical and hippocampal hypointense spots. We demonstrated that their incidence increases with aging and that they correspond either to amyloid deposits or to cerebral microhemorrhages.
Conflict of interest statement
Figures
References
-
- Courchesne E, Chisum HJ, Townsend J, Cowles A, Covington J, et al. (2000) Normal brain development and aging: quantitative analysis at in vivo MR imaging in healthy volunteers. Radiology 216: 672–682. - PubMed
-
- Dekaban AS (1978) Changes in brain weights during the span of human life: relation of brain weights to body heights and body weights. Ann Neurol 4: 345–356. - PubMed
-
- Carne RP, Vogrin S, Litewka L, Cook MJ (2006) Cerebral cortex: an MRI-based study of volume and variance with age and sex. J Clin Neurosci 13: 60–72. - PubMed
-
- Golomb J, Kluger A, de Leon MJ, Ferris SH, Mittelman M, et al. (1996) Hippocampal formation size predicts declining memory performance in normal aging. Neurology 47: 810–813. - PubMed
-
- Raz N, Gunning-Dixon FM, Head D, Dupuis JH, Acker JD (1998) Neuroanatomical correlates of cognitive aging: evidence from structural magnetic resonance imaging. Neuropsychology 12: 95–114. - PubMed
Publication types
MeSH terms
Grants and funding
LinkOut - more resources
Full Text Sources
Other Literature Sources
Medical
