

Elevated transcription of the gene QSOX1 encoding quiescin Q6 sulfhydryl oxidase 1 in breast cancer
- PMID: 23460839
- PMCID: PMC3583868
- DOI: 10.1371/journal.pone.0057327
Elevated transcription of the gene QSOX1 encoding quiescin Q6 sulfhydryl oxidase 1 in breast cancer
Abstract
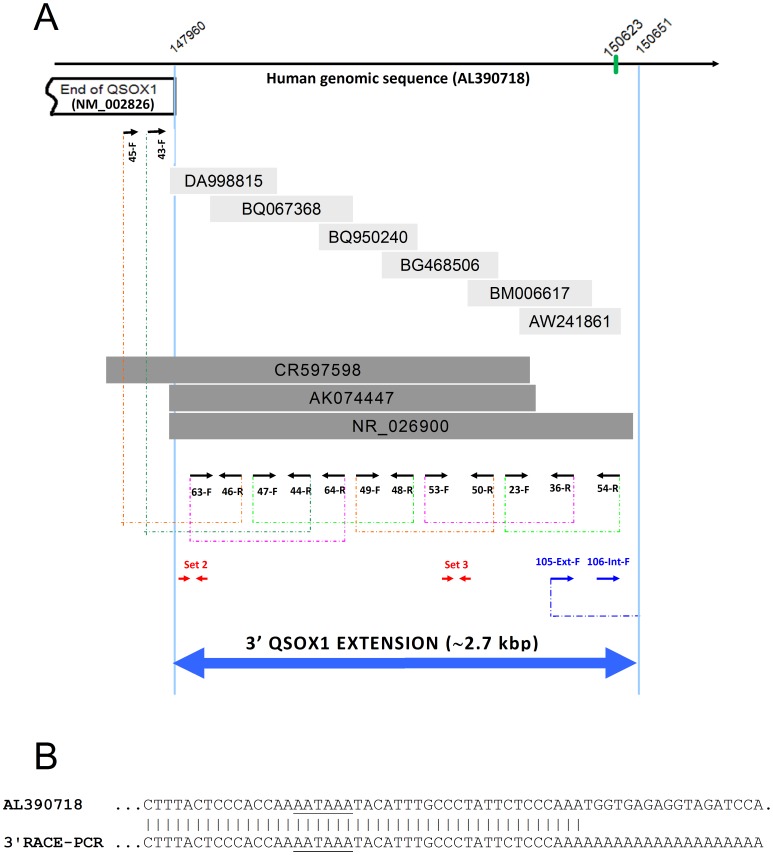
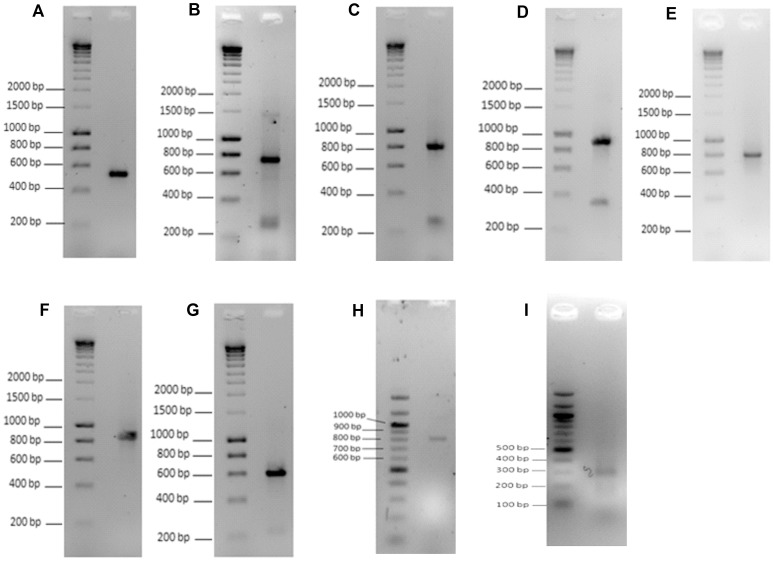
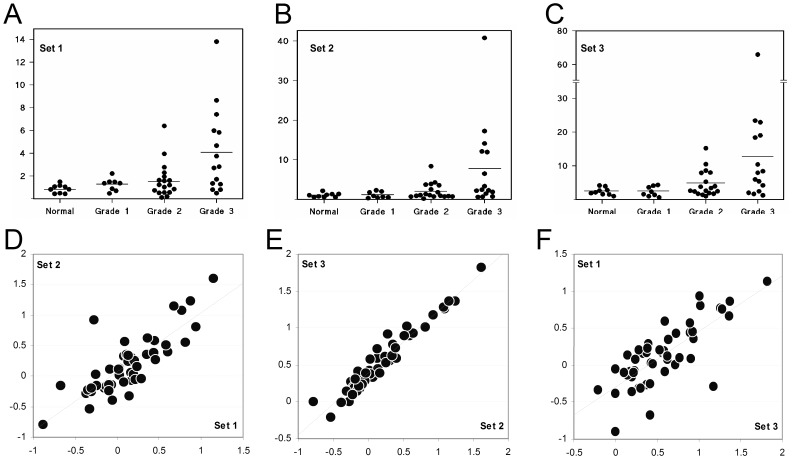
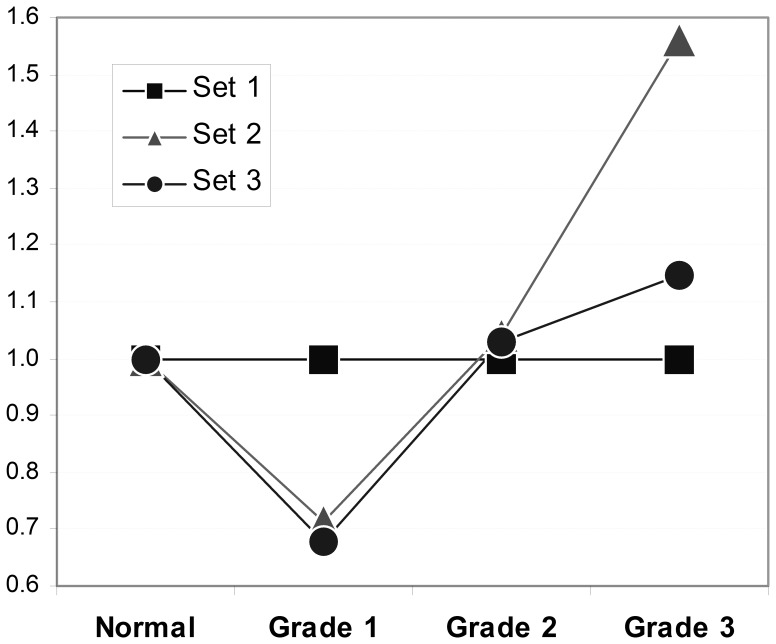
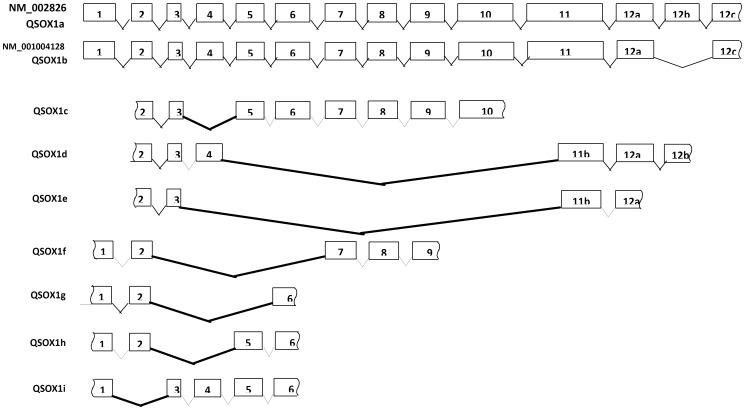
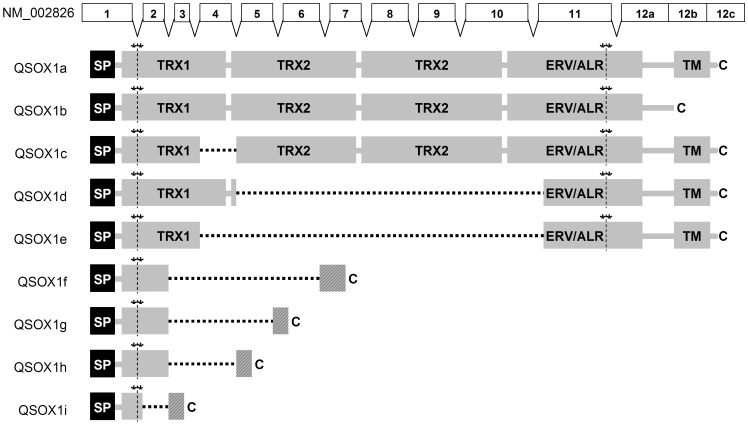
The q arm of chromosome 1 is frequently amplified at the gene level in breast cancer. Since the significance of this is unclear we investigated whether 1q genes are overexpressed in this disease. The cDNA levels of 1q-located genes were analysed in a search for overexpressed genes. 26 genes mapping to the 1q arm show highly significant (P≤0.01) overexpression of transcripts in breast cancer compared to normal breast tissue. Amongst those showing the highest levels of overexpression in both expressed sequence tag (EST) and serial analysis of gene expression (SAGE) databases was enzyme quiescin Q6 sulfhydryl oxidase 1 (QSOX1). We investigated QSOX1 cDNA derived from T47D breast carcinoma cells by RT-PCR and 3'-RACE PCR and identified a novel extended form of QSOX1 transcript, containing a long 3'UTR, nearly double the size of the previously reported QSOX1 cDNA, and confirmed its 3' end nucleotide sequence using RACE-PCR. We also used quantitative real-time PCR to analyse a panel of cDNAs derived from 50 clinically-graded normal and malignant breast tissue samples for the expression of QSOX1 mRNAs. QSOX1 transcription was elevated in an increasing proportion in the grade 2 and grade 3 tumours (graded according to the Nottingham prognostic index), with 10 of the 15 grade 3 tumours (67%) examined exceeding the normal range. There was a significant correlation between relative transcript level and clinical grade (P≤0.01) for all qPCR primer sets tested. QSOX1 mRNA levels, based on SAGE expression data, did not correlate with either Estrogen Receptor (ER) or Epidermal Growth Factor Receptor 2 (ErbB-2 or HER2/neu) expression. Our data indicate that QSOX1 is a potential new prognostic marker which may prove of use in the staging of breast tumours and the stratification of breast cancer patients.
Conflict of interest statement
Figures
Similar articles
-
QSOX1 inhibits autophagic flux in breast cancer cells.PLoS One. 2014 Jan 24;9(1):e86641. doi: 10.1371/journal.pone.0086641. eCollection 2014. PLoS One. 2014. PMID: 24475161 Free PMC article.
-
Expression of quiescin sulfhydryl oxidase 1 is associated with a highly invasive phenotype and correlates with a poor prognosis in Luminal B breast cancer.Breast Cancer Res. 2013 Mar 28;15(2):R28. doi: 10.1186/bcr3407. Breast Cancer Res. 2013. PMID: 23536962 Free PMC article.
-
High expression of QSOX1 reduces tumorogenesis, and is associated with a better outcome for breast cancer patients.Breast Cancer Res. 2012 Oct 25;14(5):R136. doi: 10.1186/bcr3341. Breast Cancer Res. 2012. PMID: 23098186 Free PMC article.
-
The emerging role of QSOX1 in cancer.Antioxid Redox Signal. 2014 Jul 20;21(3):485-96. doi: 10.1089/ars.2013.5572. Epub 2014 Feb 19. Antioxid Redox Signal. 2014. PMID: 24359107 Free PMC article. Review.
-
[Transcriptomes for serial analysis of gene expression].J Soc Biol. 2002;196(4):303-7. J Soc Biol. 2002. PMID: 12645300 Review. French.
Cited by
-
Illuminating luminal B: QSOX1 as a subtype-specific biomarker.Breast Cancer Res. 2013 May 15;15(3):104. doi: 10.1186/bcr3417. Breast Cancer Res. 2013. PMID: 23680167 Free PMC article.
-
QSOX1 expression is associated with aggressive tumor features and reduced survival in breast carcinomas.Mod Pathol. 2016 Dec;29(12):1485-1491. doi: 10.1038/modpathol.2016.148. Epub 2016 Aug 26. Mod Pathol. 2016. PMID: 27562495
-
Proteolytic processing of QSOX1A ensures efficient secretion of a potent disulfide catalyst.Biochem J. 2013 Sep 1;454(2):181-90. doi: 10.1042/BJ20130360. Biochem J. 2013. PMID: 23713614 Free PMC article.
-
QSOX1 inhibits autophagic flux in breast cancer cells.PLoS One. 2014 Jan 24;9(1):e86641. doi: 10.1371/journal.pone.0086641. eCollection 2014. PLoS One. 2014. PMID: 24475161 Free PMC article.
-
Tumor-initiating cells of breast and prostate origin show alterations in the expression of genes related to iron metabolism.Oncotarget. 2017 Jan 24;8(4):6376-6398. doi: 10.18632/oncotarget.14093. Oncotarget. 2017. PMID: 28031527 Free PMC article.
References
-
- Tirrkonen M, Tanner M, Karbhu R, Kallioniemi A, Isola J, at al (1998) Molecular cytogenetics of primary breast cancer by CGH. Genes, Chromosomes Cancer 21(3): 177–184. - PubMed
-
- Nessling M, Richter K, Schwaenen C, Roerig P, et al. (2005) Candidate genes in breast cancer revealed by microarray-based comparative genomic hybridisation of archived tissue. Cancer Res. 65(2): 439–447. - PubMed
-
- Stange D, Radlwimmer B, Schubert F, Traub F, Pich A, et al. (2006) High-resolution genomic profiling reveals association of chromosomal aberrations on 1q and 16p with histologic and genetic subgroups of invasive breast cancer. Clin. Cancer Res. 12(2): 345–352. - PubMed
MeSH terms
Substances
LinkOut - more resources
Full Text Sources
Other Literature Sources
Medical
Research Materials
Miscellaneous
