. 2013;8(2):e57709.
doi: 10.1371/journal.pone.0057709. Epub 2013 Feb 27.

Curcumin modulates DNA methylation in colorectal cancer cells

Affiliations

Curcumin modulates DNA methylation in colorectal cancer cells

Alexander Link et al. PLoS One. 2013.

Abstract

Aim: Recent evidence suggests that several dietary polyphenols may exert their chemopreventive effect through epigenetic modifications. Curcumin is one of the most widely studied dietary chemopreventive agents for colon cancer prevention, however, its effects on epigenetic alterations, particularly DNA methylation, remain unclear. Using systematic genome-wide approaches, we aimed to elucidate the effect of curcumin on DNA methylation alterations in colorectal cancer cells.

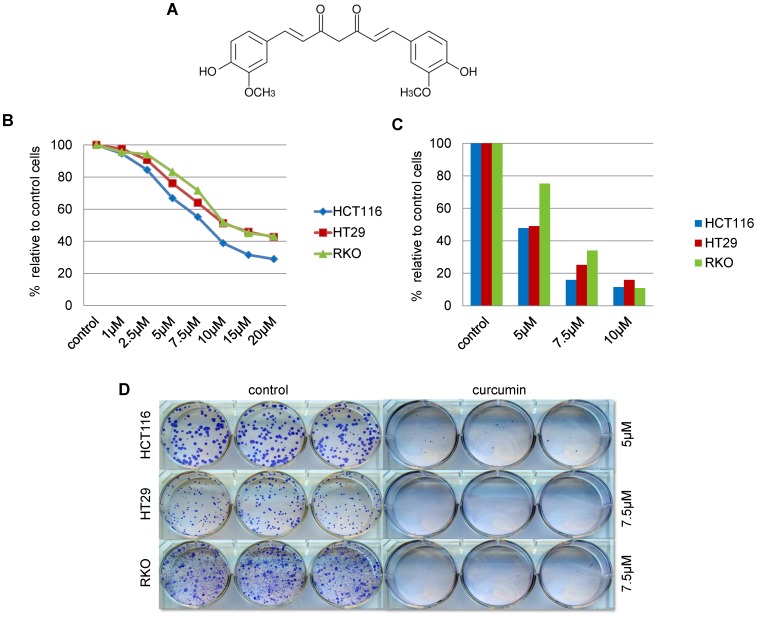
Materials and methods: To evaluate the effect of curcumin on DNA methylation, three CRC cell lines, HCT116, HT29 and RKO, were treated with curcumin. 5-aza-2'-deoxycytidine (5-aza-CdR) and trichostatin A treated cells were used as positive and negative controls for DNA methylation changes, respectively. Methylation status of LINE-1 repeat elements, DNA promoter methylation microarrays and gene expression arrays were used to assess global methylation and gene expression changes. Validation was performed using independent microarrays, quantitative bisulfite pyrosequencing, and qPCR.

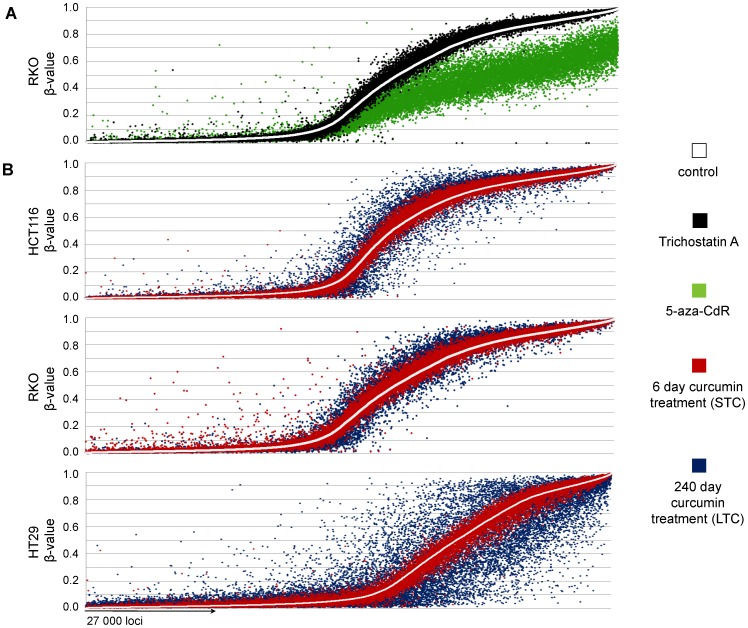
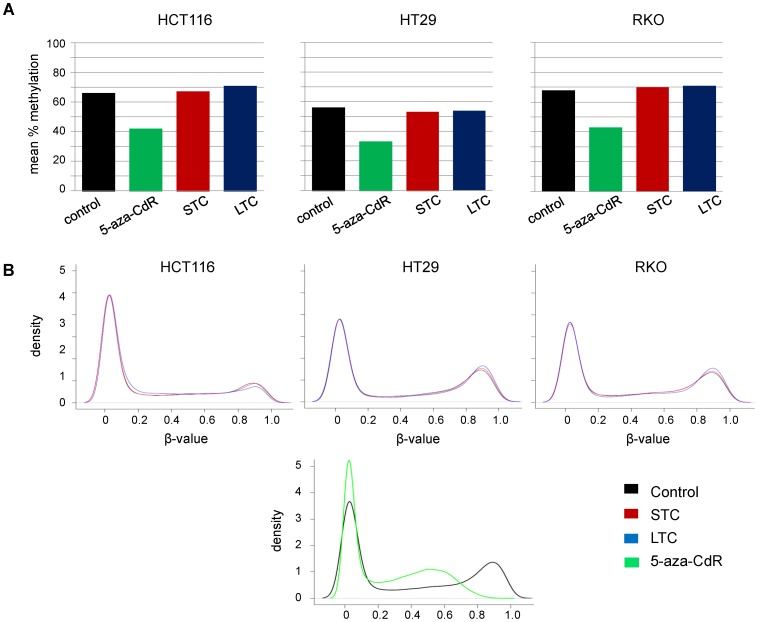
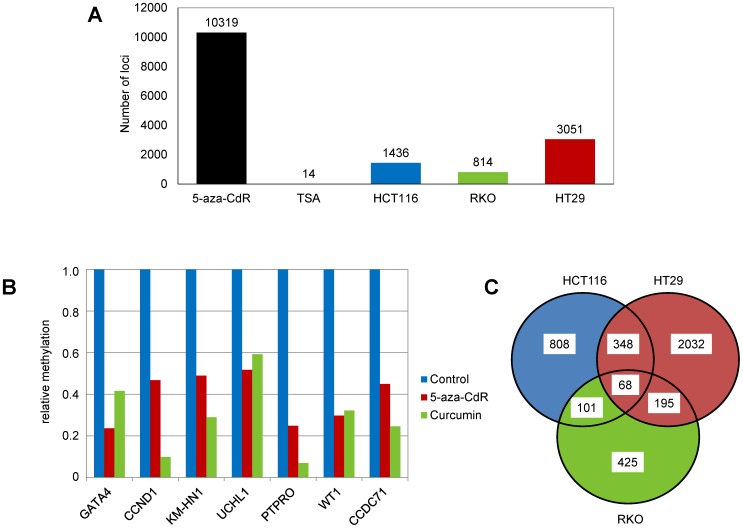
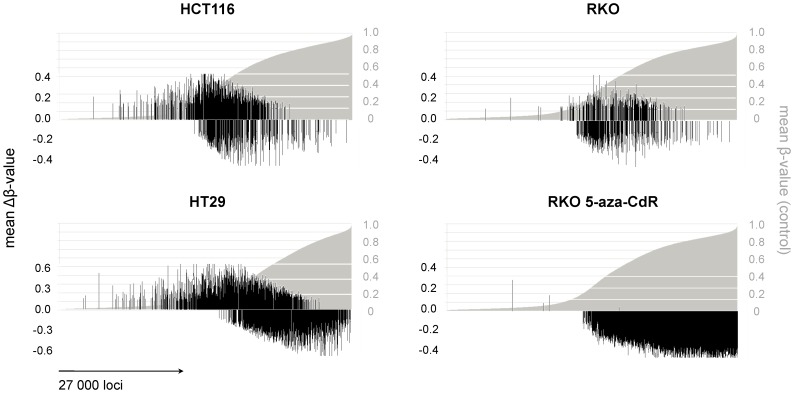
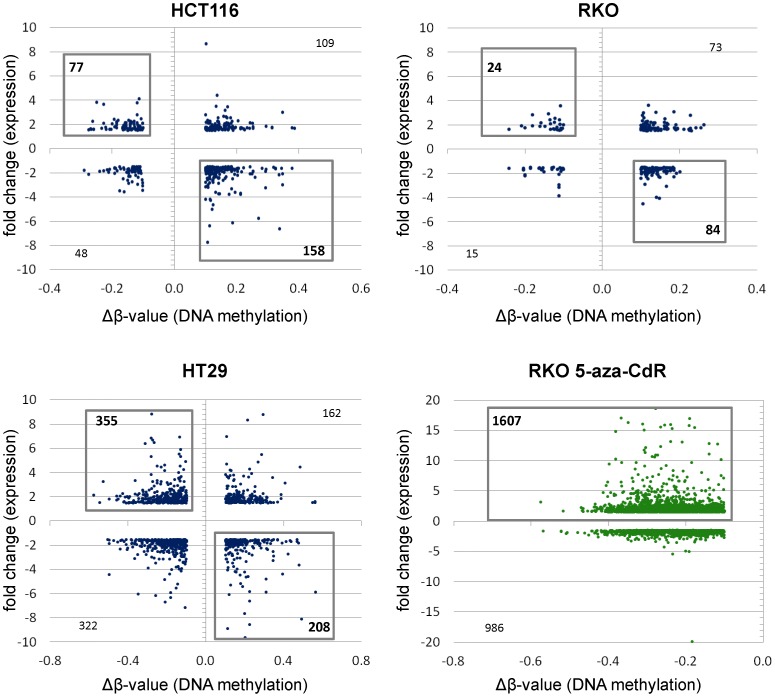
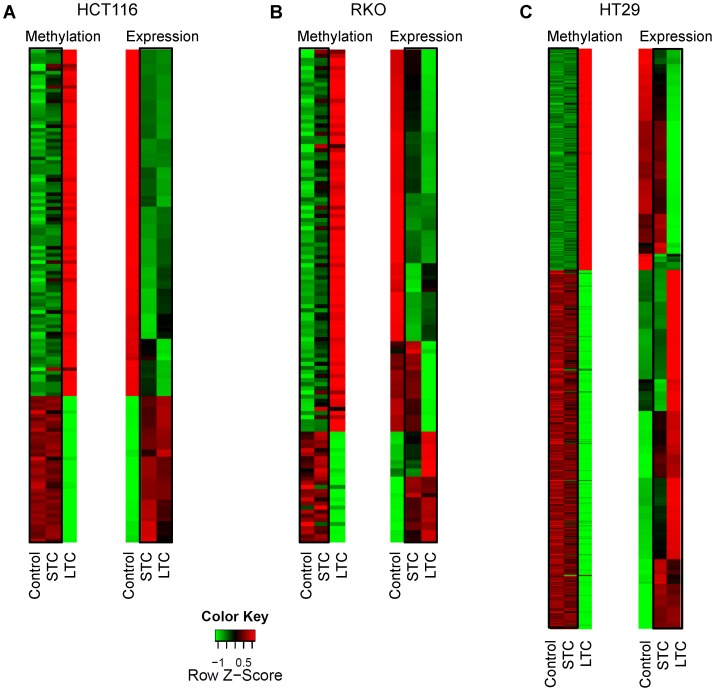
Results: As expected, genome-wide methylation microarrays revealed significant DNA hypomethylation in 5-aza-CdR-treated cells (mean β-values of 0.12), however, non-significant changes in mean β-values were observed in curcumin-treated cells. In comparison to mock-treated cells, curcumin-induced DNA methylation alterations occurred in a time-dependent manner. In contrast to the generalized, non-specific global hypomethylation observed with 5-aza-CdR, curcumin treatment resulted in methylation changes at selected, partially-methylated loci, instead of fully-methylated CpG sites. DNA methylation alterations were supported by corresponding changes in gene expression at both up- and down-regulated genes in various CRC cell lines.

Conclusions: Our data provide previously unrecognized evidence for curcumin-mediated DNA methylation alterations as a potential mechanism of colon cancer chemoprevention. In contrast to non-specific global hypomethylation induced by 5-aza-CdR, curcumin-induced methylation changes occurred only in a subset of partially-methylated genes, which provides additional mechanistic insights into the potent chemopreventive effect of this dietary nutraceutical.


Conflict of interest statement

Competing Interests: Ajay Goel currently serves as an editorial board member for PLOS ONE, however, this does not alter the authors’ adherence to all the PLOS ONE policies on sharing data and materials.

Figures

Figure 1
Figure 1. Curcumin inhibits cell viability, proliferation and colony formation of CRC cells.
(A) Chemical structure of curcumin: (1E,6E)-1,7-bis(4-hydroxy-3-methoxyphenyl)-1,6-heptadiene-3,5-dione. (B) MTT and (C) BrdU assays were performed to determine the best effective sub-toxic concentration of curcumin. CRC cells were treated with curcumin at various concentrations for 72 h (data represent the mean of independent experiments performed in triplicate). (D) The long-term anti-proliferative effects were evaluated in a colony formation assay. The cells were treated with curcumin for 12 to 16 days until distinct colonies were visible. Representative images of from an experiment illustrating colony formation results in controls (DMSO treated) and curcumin-treated HCT116, RKO and HT29 cancer cells.
Figure 2
Figure 2. Modification of multiple CpG loci following treatment of CRC cells with curcumin.
(A) For the positive control of hypomethylation, we treated RKO cells with 2.5 µM 5-aza-CdR. For the negative control, RKO cells were treated with 0.3 µM trichostatin A (TSA). (B) Three CRC cell lines from different epigenetic phenotypes were treated with effective anti-proliferative concentrations of curcumin (HCT116 7.5 µM, RKO and HT29 10 µM) for 6 and 240 days. Short treatment was associated with few changes in DNA methylation, while long-term treatment with curcumin resulted in extensive changes in CpG methylation. To compare the direct effect of the treatment on the methylation status Δβ(βcontrol–βtreatment) values were calculated accordingly for each CpG locus. The white line represents the ascending order of methylation of CpG loci in control/parental cell lines. Dots represent the direct comparison of matching CpG loci (>27,500) in treated cells.
Figure 3
Figure 3. Curcumin treatment is not associated with changes in methylation status of long interspersed nuclear elements-1 (LINE-1) that serve as surrogate markers for global DNA methylation.
(A) HCT116, RKO and HT29 were treated with 5-aza-CdR and curcumin and LINE-1 methylation status was determined using bisulfite pyrosequencing. (B) To assess changes in global methylation patterns, density plots were calculated for controls, 5-aza-CdR and curcumin-treated cell lines using Infinium global methylation microarrays. While 5-aza-CdR was responsible for a shift in CpG methylation towards hypomethylation, methylation pattern of the cells after curcumin treatment remained unchanged. Abbreviations: 5-aza-deoxycytidine (5-aza-CdR), short-term curcumin treatment (STC), long treatment with curcumin (LTC).
Figure 4
Figure 4. Validation of the curcumin-mediated methylation changes in CRC cell lines.
(A) To validate the changes in DNA methylation, the samples were re-analyzed with an Infinium microarray using independently bisulfite modified genomic DNA. The figure represents the number of CpG loci that showed CpG methylation changes with a Δβ-value of ≥0.1 in both experiments. 5-aza-CdR and TSA treated cells were used as positive and negative controls of validation. (B) Quantitative MSP (qMSP) was performed to validate the methylation changes in HCT116. Relative methylation was calculated by normalization of the methylation status of curcumin and 5-aza-CdR treated cells to controls. (C) The Venn diagram shows that CpG methylation changes overlap between HCT116, RKO and HT29 after the treatment with curcumin.
Figure 5
Figure 5. Curcumin-mediated changes in DNA methylation differ among 5-aza-CdR treated cells.
The validated CpG loci of the cell lines were ordered in ascending order. The figure represents the magnitude and the location of curcumin-affected CpG loci in relation to control cell lines. The gray curve represents the distribution of the CpG loci in ascending order. The black lines represent the Δβ-values(βcontrol–βtreatment) matching the control cells. The treatment with curcumin was associated with both hyper- and hypomethylation changes, predominantly in partially-methylated CpG loci, while 5-azaCdR treatment was responsible for non-selective hypomethylation.
Figure 6
Figure 6. Changes in curcumin-mediated modification of DNA methylation correlate with changes in gene expression.
To evaluate if curcumin-mediated changes in DNA methylation correlated with gene expression variation, we performed genome-wide gene expression analyses. Genes that showed reproducible DNA methylation changes after curcumin treatment (Δβ>0.1) were matched with genes that showed ≥1.5-fold differences in gene expression. The black boxes include those genes that showed an inverse correlation between methylation and gene expression changes.
Figure 7
Figure 7. Comparable gene expression changes among short, and long-term curcumin-treated cells.
Heatmaps displaying genes with the most discordant expression when comparing gene expression and methylation profiles with HCT116, HT29 and RKO control and treated samples. Genes were selected based on the significance of the inverse correlation between methylation and gene expression as shown in Figure 6. Rows represent genes, and columns represent samples; the intensity of each color denotes the standardized ratio between each value and the average methylation/expression of each gene across all samples. Red pixels correspond to an increased abundance of the transcript in the indicated samples, whereas green pixels indicate decreased transcript levels.

Similar articles

Cited by

References

    1. Jemal A, Siegel R, Ward E, Hao Y, Xu J, et al. (2009) Cancer statistics, 2009. CA Cancer J Clin 59: 225–249. - PubMed
    1. Feinberg AP, Ohlsson R, Henikoff S (2006) The epigenetic progenitor origin of human cancer. Nat Rev Genet 7: 21–33. - PubMed
    1. Feinberg AP (2008) Epigenetics at the epicenter of modern medicine. JAMA 299: 1345–1350. - PubMed
    1. Wong JJ, Hawkins NJ, Ward RL (2007) Colorectal cancer: a model for epigenetic tumorigenesis. Gut 56: 140–148. - PMC - PubMed
    1. Doll R, Peto R (1981) The causes of cancer: quantitative estimates of avoidable risks of cancer in the United States today. J Natl Cancer Inst 66: 1191–1308. - PubMed

Publication types

MeSH terms