. 2013:3:1390.
doi: 10.1038/srep01390.

Systematic repression of transcription factors reveals limited patterns of gene expression changes in ES cells

Affiliations

Systematic repression of transcription factors reveals limited patterns of gene expression changes in ES cells

Akira Nishiyama et al. Sci Rep. 2013.

Abstract

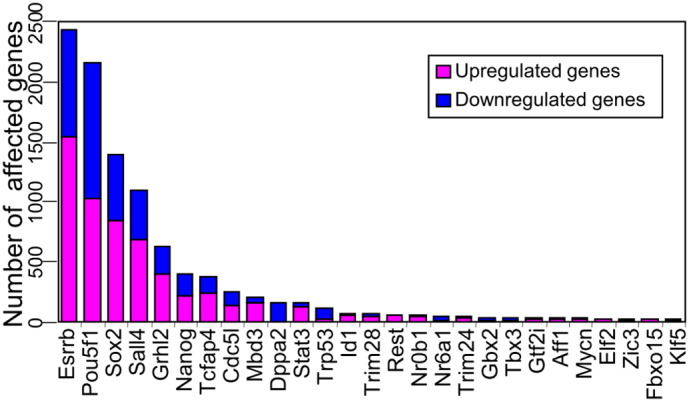
Networks of transcription factors (TFs) are thought to determine and maintain the identity of cells. Here we systematically repressed each of 100 TFs with shRNA and carried out global gene expression profiling in mouse embryonic stem (ES) cells. Unexpectedly, only the repression of a handful of TFs significantly affected transcriptomes, which changed in two directions/trajectories: one trajectory by the repression of either Pou5f1 or Sox2; the other trajectory by the repression of either Esrrb, Sall4, Nanog, or Tcfap4. The data suggest that the trajectories of gene expression change are already preconfigured by the gene regulatory network and roughly correspond to extraembryonic and embryonic fates of cell differentiation, respectively. These data also indicate the robustness of the pluripotency gene network, as the transient repression of most TFs did not alter the transcriptomes.


Figures

Figure 1
Figure 1. Knockdown of 100 transcription factors (TFs) in mouse ES cells with shRNA.
(a) experiment design; (b) list of TFs repressed in this study; TFs in bold were knocked down with two independent shRNAs; (c) change of mRNA expression of 100 TFs evaluated by microarrays and qPCR (see Supplementary Table 1); (d) Western blot shows the reduction of TF proteins; * - non-specific band.
Figure 2
Figure 2. Gene expression response after the knockdown of 16 trabscription factors with two different shRNA; r = correlation, logratio is log10; data are shown for 13929 genes with average log-expression >2.
Figure 3
Figure 3. Enrichment of transcription factor (TF) binding to genes that change their expression after the knockdown of TFs.
(a) gene rank plots for selected TFs: genes were sorted by the change of their expression and the proportion of targets was estimated in a sliding window of 500 genes; (b) z-value estimated using Parametric Analysis of Gene Set Enrichment (PAGE) which evaluates the enrichment of TF targets among genes that were upregulated or downregulated after the knockdown (see Supplementary Table 4 for the source of ChIP-seq/ChIP-chip data).
Figure 4
Figure 4. Knockdown of 100 transcription factors (TFs) with shRNA.
(a) Major TFs that changed transcriptome significantly after the knockdown (FDR < 0.05, change > = 2 fold) (see Supplementary Tables 1,2).(b) List of other TFs whose knockdown resulted in a change of expression of <20 genes.
Figure 5
Figure 5. Transcriptome changes of ES cells after the knockdown of transcription factors (TFs).
(a) principal components analysis (PCA) of log expression change of 2666 significant genes after the knockdown of transcription factors; (b) heatmap that shows gene expression changes associated with the Trajectory 1 (i.e., knockdown of Pou5f1 or Sox2) and Trajectory 2 (i.e., knockdown of Esrrb, Sall4, Nanog, and Tcfap4) (see Supplementary Table 3).
Figure 6
Figure 6. Proportion of targets of various transcription factors (TFs) (i.e., genes with TF binding sites) among genes that change their expression following trajectories 1 (a) and 2(b); (c) z-value that compares the proportions of targets of various TFs between gene groups that were upregulated versus downregulated (see Supplementary Tables 3, 4); dashed line – significance level (p = 0.05).
Only those TFs which had a significant difference in binding to upregulated genes versus downregulated genes are shown.
Figure 7
Figure 7. Two trajectories of short-term transcriptome change in ES cells following manipulation of transcription factors (TFs).
Trajectory 1 (extraembryonic direction) is characterized by the block of Pou5f1 and/or Sox2 signaling (via downregulation or interference), which leads to the downregulation of targets of Pou5f1 and Sox2. Trajectory 2 (embryonic direction) is characterized by the downregulation of targets of Esrrb and Klf4 and upregulation of targets of Polycomb factors while Pou5f1 and Sox2 are still active.

References

    1. Nishiyama A. et al. Uncovering early response of gene regulatory networks in ES cells by systematic induction of transcription factors. Cell Stem Cell (2009). - PMC - PubMed
    1. Correa-Cerro L. S. et al. Generation of mouse ES cell lines engineered for the forced induction of transcription factors. Sci Rep 1, 167 (2011). - PMC - PubMed
    1. Hu G. et al. A genome-wide RNAi screen identifies a new transcriptional module required for self-renewal. Genes Dev 23, 837–48 (2009). - PMC - PubMed
    1. Chia N. Y. et al. A genome-wide RNAi screen reveals determinants of human embryonic stem cell identity. Nature 468, 316–20 (2010). - PubMed
    1. Ivanova N. et al. Dissecting self-renewal in stem cells with RNA interference. Nature 442, 533–8 (2006). - PubMed

Publication types

Substances