. 2013 Apr 15;304(8):E874-84.
doi: 10.1152/ajpendo.00490.2012. Epub 2013 Mar 5.

Pancreatic angiotensin-converting enzyme 2 improves glycemia in angiotensin II-infused mice

Affiliations

Pancreatic angiotensin-converting enzyme 2 improves glycemia in angiotensin II-infused mice

Kavaljit H Chhabra et al. Am J Physiol Endocrinol Metab. .

Abstract

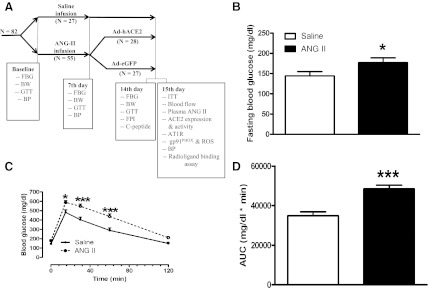
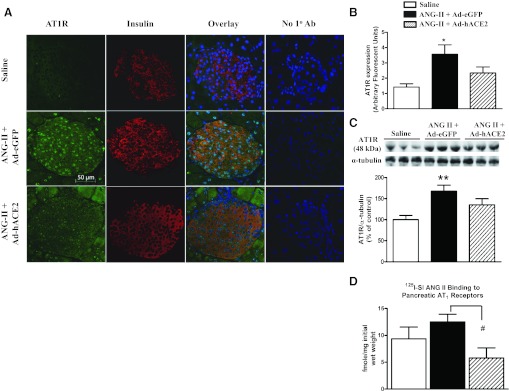
An overactive renin-angiotensin system (RAS) is known to contribute to type 2 diabetes mellitus (T2DM). Although ACE2 overexpression has been shown to be protective against the overactive RAS, a role for pancreatic ACE2, particularly in the islets of Langerhans, in regulating glycemia in response to elevated angiotensin II (Ang II) levels remains to be elucidated. This study examined the role of endogenous pancreatic ACE2 and the impact of elevated Ang II levels on the enzyme's ability to alleviate hyperglycemia in an Ang II infusion mouse model. Male C57bl/6J mice were infused with Ang II or saline for a period of 14 days. On the 7th day of infusion, either an adenovirus encoding human ACE2 (Ad-hACE2) or a control adenovirus (Ad-eGFP) was injected into the mouse pancreas. After an additional 7-8 days, glycemia and plasma insulin levels as well as RAS components expression and oxidative stress were assessed. Ang II-infused mice exhibited hyperglycemia, hyperinsulinemia, and impaired glucose-stimulated insulin secretion from pancreatic islets compared with control mice. This phenotype was associated with decreased ACE2 expression and activity, increased Ang II type 1 receptor (AT1R) expression, and increased oxidative stress in the mouse pancreas. Ad-hACE2 treatment restored pancreatic ACE2 expression and compensatory activity against Ang II-mediated impaired glycemia, thus improving β-cell function. Our data suggest that decreased pancreatic ACE2 is a link between overactive RAS and impaired glycemia in T2DM. Moreover, maintenance of a normal endogenous ACE2 compensatory activity in the pancreas appears critical to avoid β-cell dysfunction, supporting a therapeutic potential for ACE2 in controlling diabetes resulting from an overactive RAS.


Figures

Fig. 1.
Fig. 1.
Glycemic parameters following angiotensin II (Ang II) infusion. A: experimental design and various parameters measured 1 and 2 wk after Ang II infusion. Following measurement of baseline parameters, C57Bl/6J mice (n = 82) were infused with saline or Ang II (200 ng·kg−1·min−1). BD: fasting blood glucose (FBG) level (B), glucose tolerance (C), and the corresponding area under the curve (AUC; D) were measured after 7 days of infusion. Statistical significance: *P < 0.05 and ***P < 0.001 vs. saline using unpaired 1-tailed t-test (B and D) and repeated-measures ANOVA, followed by Bonferroni's posttest (C). BW, body weight; GTT, glucose tolerance test; ITT, insulin tolerance test; BP, blood pressure; ACE2, angiotensin-converting enzyme 2; ROS, reactive oxygen species; FPI, fasting plasma insulin.
Fig. 2.
Fig. 2.
Elevated Ang II downregulates ACE2 expression in the islets and reduces pancreatic ACE2 activity. A: mice treated with Ang II and the control adenovirus (Ad-eGFP) show a reduced mouse ACE2 (mACE2) expression, whereas intrapancreatic Ad-hACE2 injection restored the total amount of ACE2 in the islets. B: Ad-hACE2 was successfully delivered to the islets, as confirmed with hACE2 antibody that does not detect mACE2 (left) but does detect hACE2 (right). C: pancreatic ACE2 protein expression, determined by Western blot, confirmed both ACE2 protein reduction in Ang II-infused mice and rescue in the Ad-hACE2-treated group. D: pancreatic ACE2 activity was reduced by Ang II exposure and normalized following Ad-hACE2 treatment. Quantification for Western blot was performed from 3 blots and a total of 7 individual samples in each group. Statistical significance: *P < 0.05 and **P < 0.01 vs. saline; #P < 0.05 vs. Ang II + Ad-eGFP using 1-way ANOVA, followed by Tukey's multiple comparison test. The contrast for red channel (insulin staining) was enhanced using Adobe Photoshop 7.0 for digital quality purpose only. PC, positive control. No 1° Ab, no primary antibody.
Fig. 3.
Fig. 3.
Restoration of pancreatic ACE2 by Ad-hACE2 gene therapy attenuates hyperglycemia. Seven days after pancreatic injection of Ad-hACE2 (n = 8) or the control adenovirus Ad-eGFP (n = 8), FBG level (A), glucose tolerance (B), and the corresponding AUC (C) were determined in saline and Ang II-infused mice. Statistical significance: ***P < 0.001 vs. saline; #P < 0.05 vs. Ang-II + Ad-eGFP using 1-way ANOVA, followed by Tukey's multiple comparison test.
Fig. 4.
Fig. 4.
Ad-hACE2 gene therapy corrects insulin secretion and sensitivity in Ang II-infused mice. AF: 7 days after pancreatic injection of Ad-hACE2 (n = 8) or the control adenovirus Ad-eGFP (n = 8), GSIS (20 islets/mouse; n = 3) (A), fasting plasma insulin level (B), C-peptide levels (C), the homeostasis model assessment-estimated insulin resistance (HOMA-IR; D), insulin tolerance (E), and the corresponding AUC (F) were determined in saline and Ang II-infused mice. G: Ad-hACE2 treatment restored GSIS in Ang II-exposed mouse islets (20 islets/mouse; n = 3). Statistical significance: *P < 0.05 vs. saline; #P < 0.05 vs. Ang-II + Ad-eGFP using 1-way ANOVA, followed by Tukey's multiple comparison test (B, C, D, and F), and repeated-measures ANOVA, followed by Bonferroni's posthoc test (E). For GSIS (A and G): * and #P < 0.05 vs. 2.8 mM glucose or Ang II + Ad-eGFP; @P < 0.05 vs. saline; $P < 0.05 vs. Ang-II + Ad-eGFP using 2-way ANOVA, followed by Bonferroni's post hoc test.
Fig. 5.
Fig. 5.
Normalization of ACE2 in the islets attenuates Ang II-mediated increase in Ang II type 1 receptor (AT1R) expression. Seven days after pancreatic injection of Ad-hACE2 or the control Ad-eGFP, AT1R expression in the islets (A and B) and the pancreas (C and D) was determined by immunohistochemistry, Western blot, and radioligand-binding assay. The quantification for Western blot (graph below the blot in C) was performed from 2 blots that included 6 total individual samples in each group; n = 4 mice/group, ≥3 sections/mouse and 3 islets/section, for immunohistochemistry. D: specific (10 μM) Ang II displaceable binding of 125I-sarcosine1,isoleucine8 Ang-II (125I-SI-Ang II; 3–4 nM) to pancreatic membranes (n = 5; P = 0.07). Statistical significance: *P < 0.05 and **P < 0.01 vs. saline, using 1-way ANOVA, followed by Tukey's multiple comparison test; #P < 0.05 vs. Ang-II + Ad-eGFP unpaired 1-tailed t-test. The contrast for red channel (insulin staining) was enhanced using Adobe Photoshop 7.0 for digital quality purpose only.
Fig. 6.
Fig. 6.
Oxidative stress in the pancreas. Following 7 days of treatment with Ad-hACE2 or the control virus (Ad-eGFP), oxidative stress was assessed in the mouse pancreas by determining dihydroethidium (DHE) fluorescence and gp91phox expression. A: representative fluorescent (left) and brightfield images (right) of sections from mice pancreata are presented for each group. B: quantification was performed from 6 samples from different mice in saline and Ad-eGFP groups and 7 samples in the Ad-hACE2 group using Image J software. C: the quantification for gp91phox was performed from 3 blots, which included a total of 9 individual samples in each treatment group. Statistical significance: ***P < 0.001 vs. saline; #P < 0.01 vs. Ang-II + Ad-eGFP using 1-way ANOVA followed by Tukey's multiple comparison test. D: tempol (10 μM) restored GSIS in Ang II-exposed mouse islets. * and #P < 0.05 vs. 2.8 mM glucose and Ang II + saline group using 2-way ANOVA followed by Bonferroni's post hoc test.

References

    1. Alenina N, Xu P, Rentzsch B, Patkin EL, Bader M. Genetically altered animal models for Mas and angiotensin-(1–7). Exp Physiol 93: 528–537, 2008 - PubMed
    1. Benicky J, Hafko R, Sanchez-Lemus E, Aguilera G, Saavedra J. Six commercially available angiotensin II AT1 receptor antibodies are non-specific. Cell Mol Neurobiol 32: 1353–1365, 2012 - PMC - PubMed
    1. Bindom SM, Hans CP, Xia H, Boulares AH, Lazartigues E. Angiotensin I-converting enzyme type 2 (ACE2) gene therapy improves glycemic control in diabetic mice. Diabetes 59: 2540–2548, 2010 - PMC - PubMed
    1. Bindom SM, Lazartigues E. The sweeter side of ACE2: physiological evidence for a role in diabetes. Mol Cell Endocrinol 302: 193–202, 2009 - PMC - PubMed
    1. Butz GM, Davisson RL. Long-term telemetric measurement of cardiovascular parameters in awake mice: a physiological genomics tool. Physiol Genomics 5: 89–97, 2001 - PubMed

Publication types

MeSH terms

LinkOut - more resources