. 2013:4:1547.
doi: 10.1038/ncomms2461.

Human hypocretin and melanin-concentrating hormone levels are linked to emotion and social interaction

Affiliations

Human hypocretin and melanin-concentrating hormone levels are linked to emotion and social interaction

Ashley M Blouin et al. Nat Commun. 2013.

Abstract

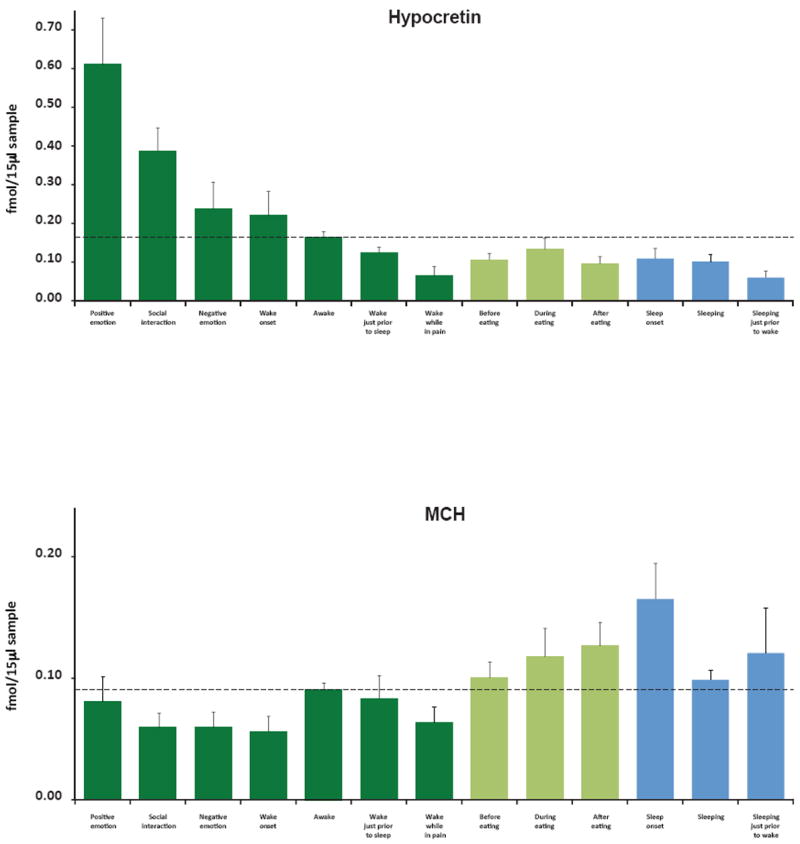
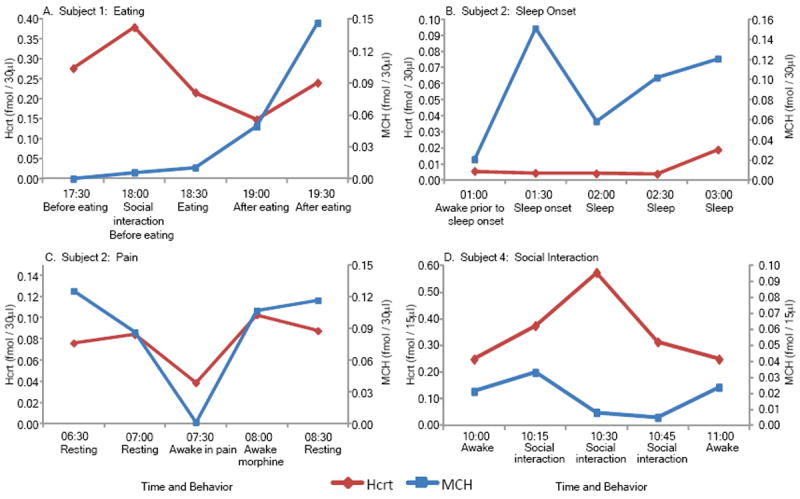
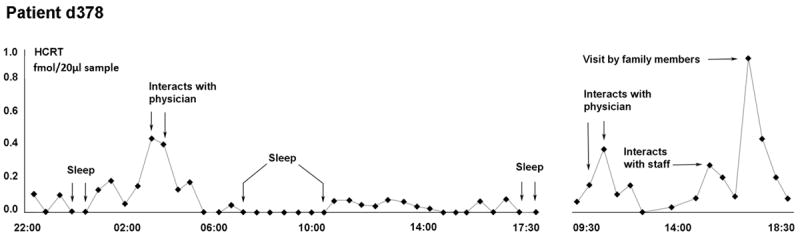
The neurochemical changes underlying human emotions and social behaviour are largely unknown. Here we report on the changes in the levels of two hypothalamic neuropeptides, hypocretin-1 and melanin-concentrating hormone, measured in the human amygdala. We show that hypocretin-1 levels are maximal during positive emotion, social interaction and anger, behaviours that induce cataplexy in human narcoleptics. In contrast, melanin-concentrating hormone levels are minimal during social interaction, but are increased after eating. Both peptides are at minimal levels during periods of postoperative pain despite high levels of arousal. Melanin-concentrating hormone levels increase at sleep onset, consistent with a role in sleep induction, whereas hypocretin-1 levels increase at wake onset, consistent with a role in wake induction. Levels of these two peptides in humans are not simply linked to arousal, but rather to specific emotions and state transitions. Other arousal systems may be similarly emotionally specialized.


Conflict of interest statement

Competing financial interests: The authors declare no competing financial interests

Figures

Figure 1
Figure 1
Location of microdialysis probes in human subjects. Placements of membranes at the tip of each probe are labeled by subject number. Horizontal lines on either side of each subject number are to scale, and their total length indicates the 5.0 mm area sampled by each membrane. The position of each membrane in the amygdala is drawn to scale. The anatomic outline graphic was adapted from the human brain atlas by Mai et al.. Bm refers to basomedial nucleus of the amygdala; BL, basolateral nucleus of the amygdala, La, lateral nucleus of the amygdala; V3, third ventricle, FX, fornix; GP, globus pallidus; PUT, putamen; CL, claustrum; EC, entorhinal cortex; OT, optic tract; AC, anterior commissure.
Figure 2
Figure 2
Hcrt and MCH levels across waking and sleep activities. (A) Maximal Hcrt levels in waking are seen during positive emotions, social interactions and awakening, minimal levels are seen prior to sleep and while reporting pain. Changes during and after eating are smaller than those during monitored non-eating related activities. Waking values in shades of green, sleep in blue. Awake indicates samples in which subjects were awake but were not exhibiting social interaction or reporting emotion. (B) Maximal MCH levels are seen at sleep onset and after eating. Minimal levels are seen during wake onset, social interaction and pain. Error bars represent ±SEM.
Figure 3
Figure 3
Examples of single case raw data on Hcrt and MCH release from individual patients. Release pattern over time shows that (A) MCH levels increase after eating, (B) MCH levels increase at sleep onset, (C) both Hcrt and MCH levels are low during pain and (D) Hcrt levels increase with social interaction. With the exception of the example shown in C, all data in this study were collected during morphine-free periods. See figure 2 for average levels in each condition.
Figure 4
Figure 4
Time course of Hcrt release over a 20 h period in patient d378. A Hospal dialysis membrane was used in this subject who was therefore not used in the statistical comparisons with the other 7 subjects. However the results with these two membrane types were indistinguishable. Hcrt release is minimal during sleep and maximal during periods of social interaction.
Figure 5
Figure 5
Design and placement of electrodes. (A) Electrode contained external contacts for localizing seizure focus and internal space for a 200μm diameter microdialysis membrane. The membrane protruded 5 mm from the outer cannula. aCSF flowed in through a 105μm outer diameter silica tube and flowed out of the Cuprophan membrane through a 150μm outer diameter silica tube. Dialysates were collected at 15 min intervals and immediately frozen to -80 degrees. Samples were subsequently analyzed for both Hcrt-1 and MCH using our multiple antigen solid state RIA. (B) Image of implanted probe in the amygdala (metal contacts produce MRI artifact). CT image of electrode was superimposed on MRI after computer registration (alignment in 3 dimensions) of the two scans.

Similar articles

Cited by

References

    1. Peyron C, et al. A mutation in a case of early onset narcolepsy and a generalized absence of hypocretin peptides in human narcoleptic brains. Nat Med. 2000;6:991–997. - PubMed
    1. Thannickal TC, et al. Reduced number of hypocretin neurons in human narcolepsy. Neuron. 2000;27:469–474. - PMC - PubMed
    1. Liu M, et al. Orexin gene transfer into zona incerta neurons suppresses muscle paralysis in narcoleptic mice. J Neurosci. 2002;31:6028–6040. - PMC - PubMed
    1. Siegel JM. Hypocretin (orexin): role in normal behavior and neuropathology. Annual Rev of Psychol. 2004;55:125–148. - PMC - PubMed
    1. McGregor R, Wu M-F, Barber G, Ramanathan L, Siegel JM. Highly specific role of hypocretin (orexin) neurons: differential activation as a function of diurnal phase, operant reinforcement vs. operant avoidance and light level. Journal of Neuroscience. 2011;31:15455–15467. - PMC - PubMed

Publication types

MeSH terms