

Tissue metabolomics of hepatocellular carcinoma: tumor energy metabolism and the role of transcriptomic classification
- PMID: 23463346
- PMCID: PMC3695036
- DOI: 10.1002/hep.26350
Tissue metabolomics of hepatocellular carcinoma: tumor energy metabolism and the role of transcriptomic classification
Abstract
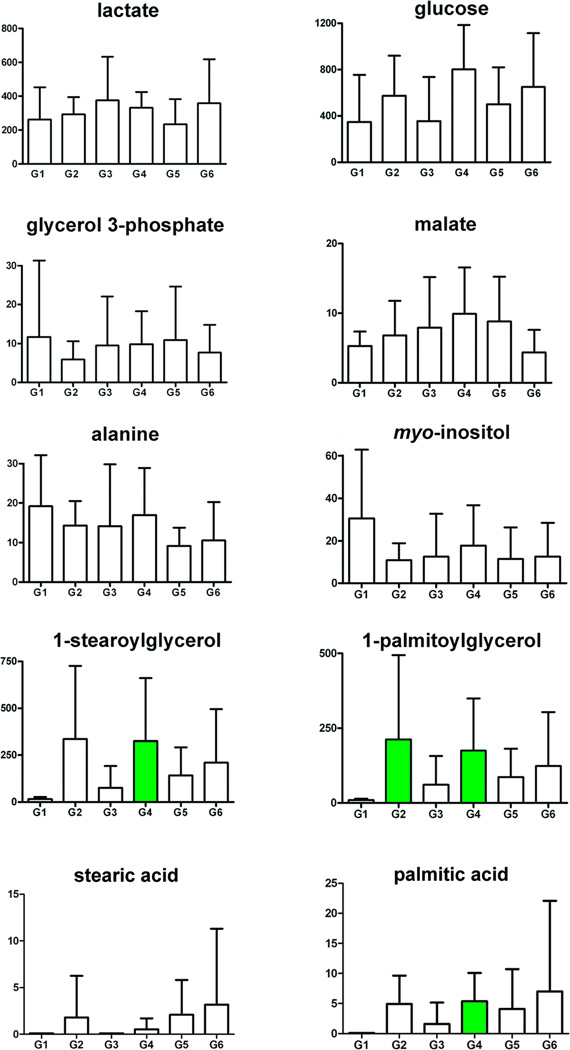
Hepatocellular carcinoma (HCC) is one of the commonest causes of death from cancer. A plethora of metabolomic investigations of HCC have yielded molecules in biofluids that are both up- and down-regulated but no real consensus has emerged regarding exploitable biomarkers for early detection of HCC. We report here a different approach, a combined transcriptomics and metabolomics study of energy metabolism in HCC. A panel of 31 pairs of HCC tumors and corresponding nontumor liver tissues from the same patients was investigated by gas chromatography-mass spectrometry (GCMS)-based metabolomics. HCC was characterized by ∼2-fold depletion of glucose, glycerol 3- and 2-phosphate, malate, alanine, myo-inositol, and linoleic acid. Data are consistent with a metabolic remodeling involving a 4-fold increase in glycolysis over mitochondrial oxidative phosphorylation. A second panel of 59 HCC that had been typed by transcriptomics and classified in G1 to G6 subgroups was also subjected to GCMS tissue metabolomics. No differences in glucose, lactate, alanine, glycerol 3-phosphate, malate, myo-inositol, or stearic acid tissue concentrations were found, suggesting that the Wnt/β-catenin pathway activated by CTNNB1 mutation in subgroups G5 and G6 did not exhibit specific metabolic remodeling. However, subgroup G1 had markedly reduced tissue concentrations of 1-stearoylglycerol, 1-palmitoylglycerol, and palmitic acid, suggesting that the high serum α-fetoprotein phenotype of G1, associated with the known overexpression of lipid catabolic enzymes, could be detected through metabolomics as increased lipid catabolism.
Conclusion: Tissue metabolomics yielded precise biochemical information regarding HCC tumor metabolic remodeling from mitochondrial oxidation to aerobic glycolysis and the impact of molecular subtypes on this process.
Copyright © 2013 American Association for the Study of Liver Diseases.
Figures


Comment in
-
Hepatitis: Long-term therapy of chronic hepatitis B reverses cirrhosis.Nat Rev Gastroenterol Hepatol. 2013 Apr;10(4):199-200. doi: 10.1038/nrgastro.2013.13. Epub 2013 Jan 29. Nat Rev Gastroenterol Hepatol. 2013. PMID: 23358397 No abstract available.
References
-
- Perz JF, Armstrong GL, Farrington LA, Hutin YJ, Bell BP. The contributions of hepatitis B virus and hepatitis C virus infections to cirrhosis and primary liver cancer worldwide. J Hepatol. 2006;45:529–538. - PubMed
-
- Forner A, Llovet JM, Bruix J. Hepatocellular carcinoma. Lancet. 2012;379:1245–1255. - PubMed
-
- Lencioni R. Surveillance and early diagnosis of hepatocellular carcinoma. Dig Liver Dis. 2010;42(Suppl 3):S223–S227. - PubMed
-
- Chen CJ, Lee MH. Early diagnosis of hepatocellular carcinoma by multiple microRNAs: validity, efficacy, and cost-effectiveness. J Clin Oncol. 2011;29:4745–4747. - PubMed
Publication types
MeSH terms
Substances
Grants and funding
LinkOut - more resources
Full Text Sources
Other Literature Sources
Medical
Research Materials
Miscellaneous