. 2013 Apr 23;7(4):3118-29.
doi: 10.1021/nn3053439. Epub 2013 Mar 14.

Multimodal in vivo imaging exposes the voyage of nanoparticles in tumor microcirculation

Affiliations

Multimodal in vivo imaging exposes the voyage of nanoparticles in tumor microcirculation

Randall Toy et al. ACS Nano. .

Abstract

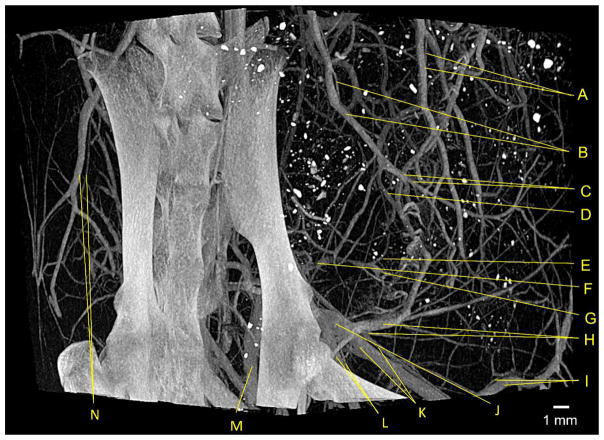
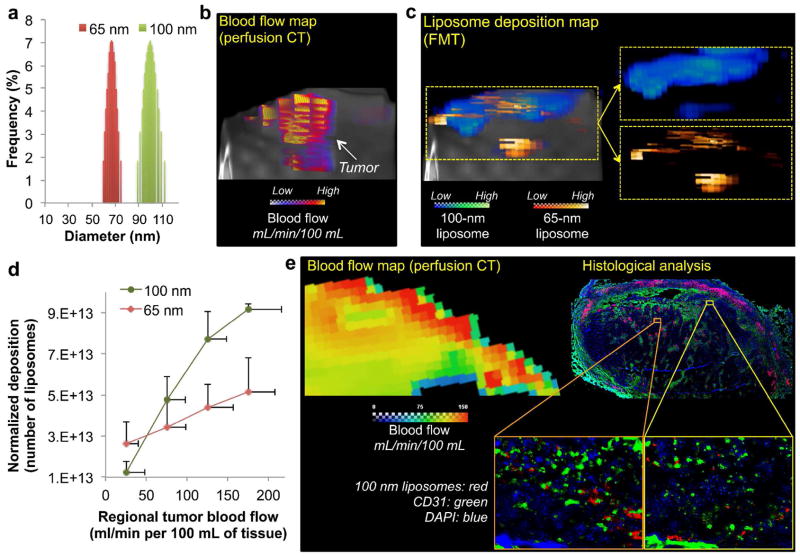
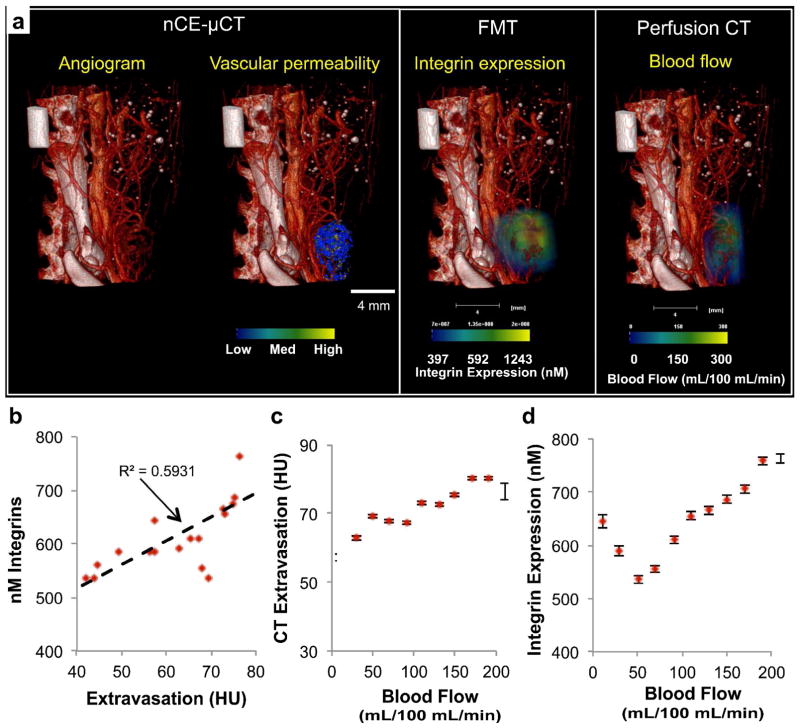
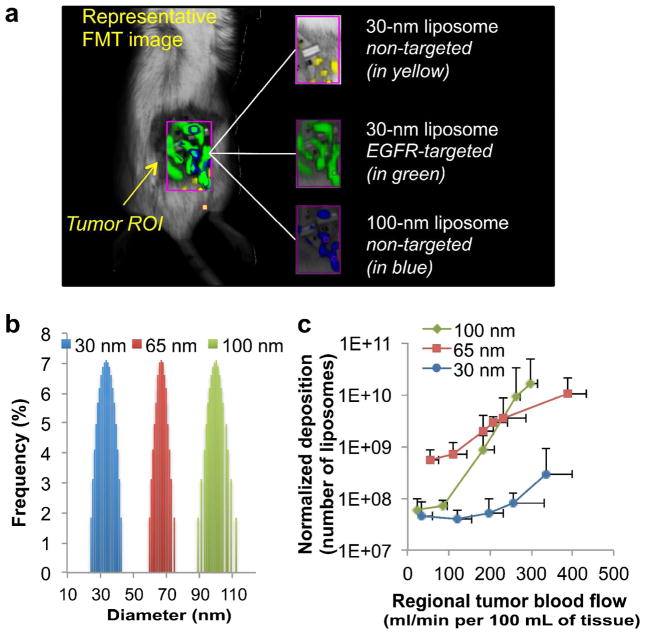
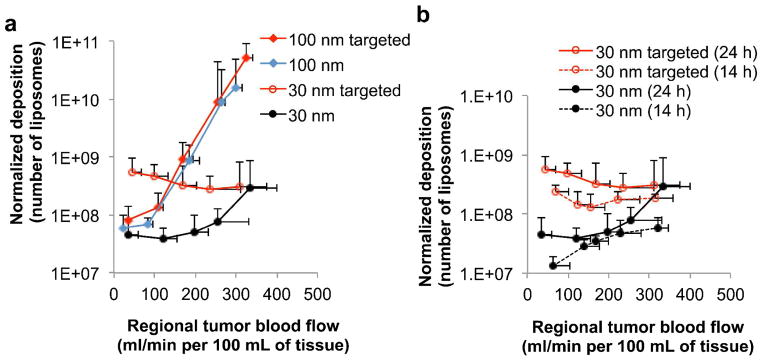
Tumors present numerous biobarriers to the successful delivery of nanoparticles. Decreased blood flow and high interstitial pressure in tumors dictate the degree of resistance to extravasation of nanoparticles. To understand how a nanoparticle can overcome these biobarriers, we developed a multimodal in vivo imaging methodology, which enabled the noninvasive measurement of microvascular parameters and deposition of nanoparticles at the microscopic scale. To monitor the spatiotemporal progression of tumor vasculature and its vascular permeability to nanoparticles at the microcapillary level, we developed a quantitative in vivo imaging method using an iodinated liposomal contrast agent and a micro-CT. Following perfusion CT for quantitative assessment of blood flow, small animal fluorescence molecular tomography was used to image the in vivo fate of cocktails containing liposomes of different sizes labeled with different NIR fluorophores. The animal studies showed that the deposition of liposomes depended on local blood flow. Considering tumor regions of different blood flow, the deposition of liposomes followed a size-dependent pattern. In general, the larger liposomes effectively extravasated in fast flow regions, while smaller liposomes performed better in slow flow regions. We also evaluated whether the tumor retention of nanoparticles is dictated by targeting them to a receptor overexpressed by the cancer cells. Targeting of 100 nm liposomes showed no benefits at any flow rate. However, active targeting of 30 nm liposomes substantially increased their deposition in slow flow tumor regions (∼12-fold increase), which suggested that targeting prevented the washout of the smaller nanoparticles from the tumor interstitium back to blood circulation.


Figures

Figure 1
Figure 1
An example of a high-resolution angiogram using nCE-μCT. A rat bearing a 13762 MAT B III breast tumor inoculated into the mammary fat pad was injected with a high dose of iodinated nanoparticle contrast agent resulting in a blood pool concentration of 35 mg/mL iodine. Imaging was done 4 days after tumor inoculation using with nCE-μCT (high-resolution scan, 28 μm isotropic voxel). Major vascular structures were identified, including the: (A) Uterine vein and artery, (B) iliolumbar vein and artery, (C) lumbar branches of iliolumbar vein and artery, (D) iliac branch of iliolumbar vein, (E) left colic vein, (F) inferior mesenteric vein, (G) superior hemorrhoidal vein, (H) hypogastric vein and artery, (I) inferior epigastric vein and artery, (J) common iliac vein, (K) external iliac vein and artery, (L) internal iliac vein and artery, (M) l. internal iliac vein, (N) iliolumbar vein and artery. In all cases, the vein is the larger of the two labeled vessels.
Figure 2
Figure 2
An example of longitudinal imaging of the progression of tumor microvasculature and its permeability to a 100-nm liposome using nCE-μCT. (a) Large field of view and low resolution (99 μm) images of the initial steps of tumor development using longitudinal nCE-μCT imaging. A rat with a 13762 MAT B III tumor inoculated orthotopically in the mammary fat pad was imaged at 99 μm resolution before and on days 2, 4 and 8 after tumor inoculation. Maximum intensity projections (MIPs) show the lower abdominal region of the rat at the site of tumor inoculation. The white arrows label the area with tumor vasculature development and subsequent nanoparticle contrast agent extravasation. (b) Small field of view and high resolution (28 μm) images of the initial steps of tumor development using longitudinal nCE-μCT imaging. A rat with a 13762 MAT B III tumor inoculated orthotopically in the mammary fat pad was imaged before and on days 2, 6, and 8 after tumor inoculation. Column 1: A thresholded colormap was applied to volume rendered images in AMIRA, where manual segmentation was used to isolate regions with low extravasation (purple) from high extravasation (green). Column 2: Volume rendered images without manual segmentation. Column 3: Manually segmented extravasation in the absence of blood vessels.
FIGURE 3
FIGURE 3
Dependence of liposome deposition into tumors on the liposome size and blood flow. (a) The size distribution of two different liposome classes (65 and 100 nm) as measured by dynamic light scattering. (b) Perfusion CT was performed on rats with 13672 MAT B III tumors to generate 3D maps of blood flow in tumors. (c) Following tumor blood flow mapping, the tumor deposition of two different liposome classes (65 and 100 nm) was non-invasively measured using FMT imaging at 24 h after injection. To image the two liposome classes in the same tumors, distinct NIR fluorophores were used to distinguish each class of liposome inside the tumor. A representative 3D FMT image is shown as an example. (d) The intratumoral deposition of liposomes with two different sizes is shown as a function of regional blood flow in tumors. The injection dose of each liposome class contained equal number of particles. The deposition was normalized to the fractional blood volume (fBV) of each region. The data of blood flow and liposome deposition is presented as mean ± SD in a given 3D ROI (n=4 animals). (e). Fluorescence image of a histological section of a 13762 MAT B III tumor shows the microdistribution of 100-nm liposomes (5x magnification; red: 100-nm liposome; blue: nuclear stain (DAPI); green: endothelium (CD31)). Images of entire histological sections of the organs were obtained using the automated tiling function of the microscope. Care was taken to obtain tissue sections from the same location of the tumor with the same orientation as that of the blood flow map obtained using perfusion CT. Insets: The location of liposomes is shown with respect to blood vessels (10x magnification).
Figure 4
Figure 4
Multimodal in vivo imaging of vasculature, vascular permeability, integrin expression and blood flow in an orthotopic 4T1 mammary tumor in mouse. (a) Following nCE-μCT, FMT (after injection of integrin-targeting probe), and standard perfusion CT of the same animal with a mammary tumor, the angiogram (28 μm resolution) was overlaid with the map of vascular permeability, a map of integrin expression (FMT imaging), and a map of tumor blood flow (perfusion CT). Correlations were assessed between (b) vascular permeability and integrin expression, (c) vascular permeability and blood flow, and (d) blood flow and integrin expression. Error bars indicate standard error of the mean value of the measurement within each ROI (n=1 animal).
Figure 5
Figure 5
Dependence of liposome extravasation into tumors on the liposome size and blood flow on a region-by-region basis. (a) The intratumoral deposition of the different liposome classes (i.e. different sizes, targeted or non-targeted) was measured in an orthotopic mouse mammary tumor (4T1) using fluorescence molecular tomography (FMT). To image all four liposome classes in the same tumors, distinct NIR fluorophores were used to distinguish each class of liposome inside the tumor. A representative FMT image is shown as an example. (b) The size distribution of three different liposome classes (30, 65 and 100 nm) as measured by dynamic light scattering. (c) The intratumoral deposition of liposomes with the 3 different sizes is shown as a function of regional blood flow in tumors. Following tumor blood flow mapping using perfusion CT, the tumor deposition of the three different liposome classes (30, 65 and 100 nm) was non-invasively measured using FMT imaging at 24 h after injection. The injection dose of each liposome class contained an equal number of particles. The deposition was normalized to the fractional blood volume (fBV) of each region. The data of blood flow and liposome deposition is presented as mean ± SD in a given 3D ROI (n=5 animals; 5–6 tumor regions (flow zones) per animal per liposome class). The scale of the y-axis is logarithmic.
Figure 6
Figure 6
Dependence of liposome extravasation into tumors on the liposome size, active targeting towards the EGF receptor, and blood flow on a region-by-region basis. (a) Following tumor blood flow mapping using perfusion CT, the intratumoral deposition of four different liposome classes (30 and 100 nm with or without EGFR-targeting ligands) was quantitatively measured in the orthotopic mouse (4T1) mammary tumor using FMT imaging at 24 h after injection. To image all four liposome classes in the same tumors, distinct NIR fluorophores were used to distinguish each class of liposome inside the tumor. The intratumoral deposition of liposomes is shown as a function of regional blood flow in tumors. (b) Comparison of the four liposome classes is shown at two different time points (i.e. 14 and 24 h after injection). The deposition was normalized to the fractional blood volume (fBV) of each region. The data of blood flow and liposome deposition is presented as mean ± SD in a given 3D ROI (n=5 animals; 5–6 tumor regions (flow zones) per animal per liposome class). The scale of the y-axis is logarithmic.

References

    1. Maeda H, Wu J, Sawa T, Matsumura Y, Hori K. Tumor Vascular Permeability and the EPR Effect in Macromolecular Therapeutics: A Review. J Controlled Release. 2000;65:271–284. - PubMed
    1. Peiris PM, Bauer L, Toy R, Tran E, Pansky J, Doolittle E, Schmidt E, Hayden E, Mayer A, Keri RA, et al. Enhanced Delivery of Chemotherapy to Tumors Using a Multicomponent Nanochain with Radio-Frequency-Tunable Drug Release. ACS Nano. 2012;6:4157–4168. - PMC - PubMed
    1. Service RF. Materials and Biology. Nanotechnology Takes Aim at Cancer. Science. 2005;310:1132–1134. - PubMed
    1. Ferrari M. Cancer Nanotechnology: Opportunities and Challenges. Nat Rev Cancer. 2005;5:161–171. - PubMed
    1. Pope-Harman A, Cheng MM, Robertson F, Sakamoto J, Ferrari M. Biomedical Nanotechnology for Cancer. Med Clin North Am. 2007;91:899–927. - PubMed

Publication types

MeSH terms