. 2013 Jul;7(7):1322-32.
doi: 10.1038/ismej.2013.32. Epub 2013 Mar 7.

High-resolution SAR11 ecotype dynamics at the Bermuda Atlantic Time-series Study site by phylogenetic placement of pyrosequences

Affiliations

High-resolution SAR11 ecotype dynamics at the Bermuda Atlantic Time-series Study site by phylogenetic placement of pyrosequences

Kevin L Vergin et al. ISME J. 2013 Jul.

Abstract

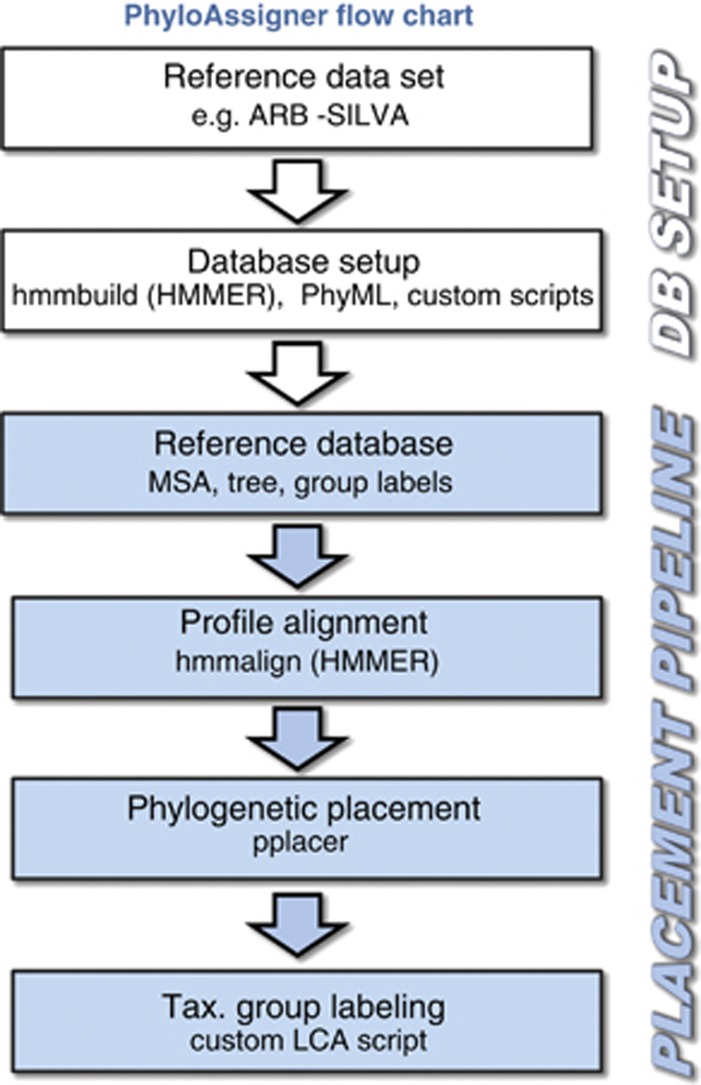
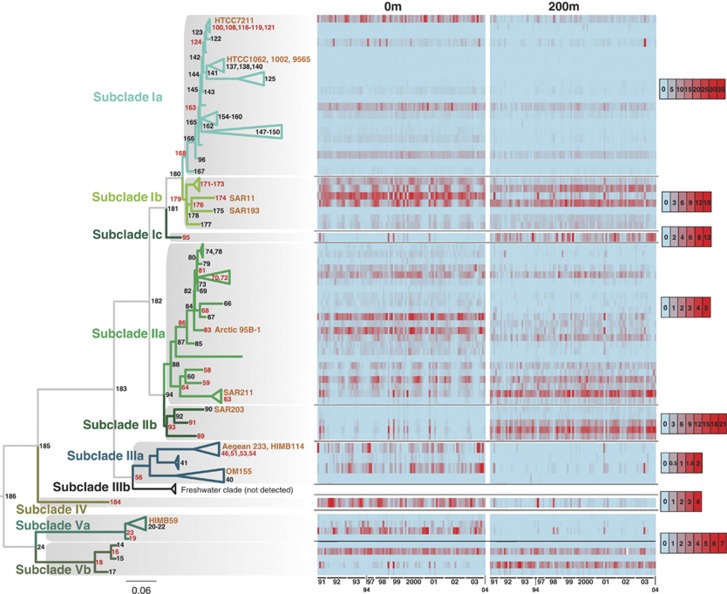
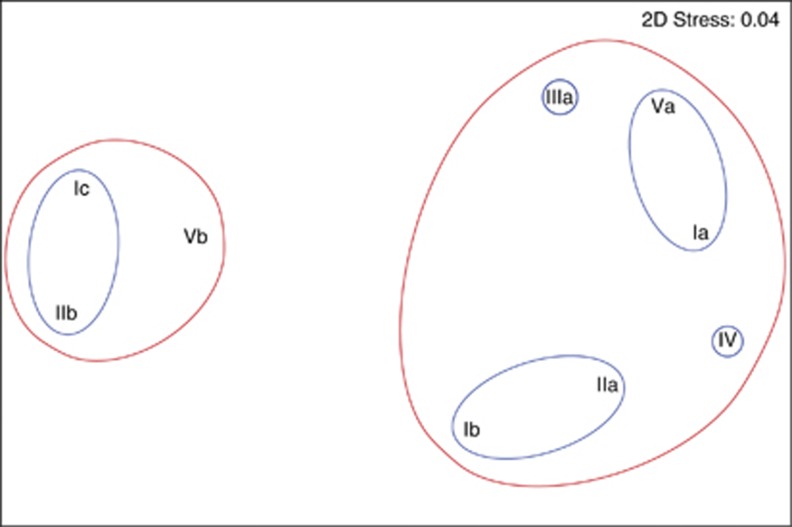
Advances in next-generation sequencing technologies are providing longer nucleotide sequence reads that contain more information about phylogenetic relationships. We sought to use this information to understand the evolution and ecology of bacterioplankton at our long-term study site in the Western Sargasso Sea. A bioinformatics pipeline called PhyloAssigner was developed to align pyrosequencing reads to a reference multiple sequence alignment of 16S ribosomal RNA (rRNA) genes and assign them phylogenetic positions in a reference tree using a maximum likelihood algorithm. Here, we used this pipeline to investigate the ecologically important SAR11 clade of Alphaproteobacteria. A combined set of 2.7 million pyrosequencing reads from the 16S rRNA V1-V2 regions, representing 9 years at the Bermuda Atlantic Time-series Study (BATS) site, was quality checked and parsed into a comprehensive bacterial tree, yielding 929 036 Alphaproteobacteria reads. Phylogenetic structure within the SAR11 clade was linked to seasonally recurring spatiotemporal patterns. This analysis resolved four new SAR11 ecotypes in addition to five others that had been described previously at BATS. The data support a conclusion reached previously that the SAR11 clade diversified by subdivision of niche space in the ocean water column, but the new data reveal a more complex pattern in which deep branches of the clade diversified repeatedly across depth strata and seasonal regimes. The new data also revealed the presence of an unrecognized clade of Alphaproteobacteria, here named SMA-1 (Sargasso Mesopelagic Alphaproteobacteria, group 1), in the upper mesopelagic zone. The high-resolution phylogenetic analyses performed herein highlight significant, previously unknown, patterns of evolutionary diversification, within perhaps the most widely distributed heterotrophic marine bacterial clade, and strongly links to ecosystem regimes.


Figures

Figure 1
Figure 1
Schematic representation of steps in the PhlyoAssigner pipeline. The first two steps (white boxes) correspond to the database setup (DB setup) and the last four (blue boxes) to the placement pipeline. ARB-SILVA, ARB program and SILVA database located online at www.arb-silva.de; MSA, multiple sequence alignment; Tax., taxonomic; LCA, last common ancestor.
Figure 2
Figure 2
Non-metric multidimensional scaling plot of 384 samples from the BATS time series as characterized by the Alphaproteobacteria community. Samples from the surface (0 and 40 m), mid-level (80, 100 and 120 m) and deep (160, 200, 250 and 300 m) are shown in green, blue and magenta, respectively.
Figure 3
Figure 3
SAR11 subclade dynamics at BATS. Each node or collapsed group of nodes on the reference tree has a corresponding row in the heat plots. Heat plot columns represent individual sampling dates, summarized by year (x axis). All information for each node is displayed for 0 and 200 m. Red bars correspond to percent abundance of pyrosequences localized to a node for a given depth and sample date, as given by the scale bars on the right. Note that subclades are on different scales to provide resolution for subclades with lower abundances than Ia. Nodes with particularly high abundance are colored red. Reference sequences from cultures or previously published subclade identification sequences (for example, SAR11 and OM155) are indicated in orange. Scale bar indicates 0.06 changes per position.
Figure 4
Figure 4
Ocean Data View plots of SAR11 subclades and depth-specific distributions. Data from the upper 300 m during a 9 year time series were averaged over a 1 year time frame after adjusting to the month of deepest mixing (month 0) to determine relative subclade abundances. White lines indicate average mixed layer depth. Heat maps (scale to the right of each plot) are adjusted to show the spatiotemporal maximum for each subclade. (a) Subclade IIa; (b) subclade IIb; (c) subclade Ic; (d) subclade Ib; (e) subclade Vb; (f) subclade Va; (g) subclade Ia; (h) subclade IV; and (i) subclade IIIa.
Figure 5
Figure 5
Non-metric multidimensional scaling plots for Spearman correlations among the nine SAR11 subclades based on average read abundance data in all samples. Correlations of 0.26 and 0.65 are indicated by red and blue lines, respectively.
Figure 6
Figure 6
Comparison of a similarity matrix based on SAR11 subclade profiles for each month over 7 years versus modeled matrices for monthly (a), or seasonal (b) cyclical transitions. Histogram plots represent the results of 100 000 random permutations of the data matrix compared with the respective model matrix. Spearman correlations for data comparisons to the model were similar and significantly non-random (ρ>0.11, significance level below 0.0001), indicating a good fit to both models.

References

    1. Altschul SF, Gish W, Miller W, Myers EW, Lipman DJ. Basic local alignment search tool. J Mol Biol. 1990;215:403–410. - PubMed
    1. Berger SA, Krompass D, Stamatakis A. Performance, accuracy, and web server for evolutionary placement of short sequence reads under maximum likelihood. Syst Biol. 2011;60:291–302. - PMC - PubMed
    1. Binladen J, Gilbert MTP, Bollback JP, Panitz F, Bendixen C, Nielsen R, et al. The use of coded PCR primers enables high-throughput sequencing of multiple homolog amplification products by 454 parallel sequencing. PLoS One. 2007;2:e197. - PMC - PubMed
    1. Brindefalk B, Ettema TJ, Viklund J, Thollesson M, Andersson SG. A phylometagenomic exploration of oceanic alphaproteobacteria reveals mitochondrial relatives unrelated to the SAR11 clade. PLoS One. 2011;6:e24457. - PMC - PubMed
    1. Brown MV, Lauro FM, DeMaere MZ, Muir L, Wilkins D, Thomas T, et al. Global biogeography of SAR11 marine bacteria. Mol Syst Biol. 2012;8:595. - PMC - PubMed

Publication types

Substances