. 2013 Apr 25;496(7446):461-8.
doi: 10.1038/nature11981. Epub 2013 Mar 6.

Dynamic regulatory network controlling TH17 cell differentiation

Affiliations

Dynamic regulatory network controlling TH17 cell differentiation

Nir Yosef et al. Nature. .

Abstract

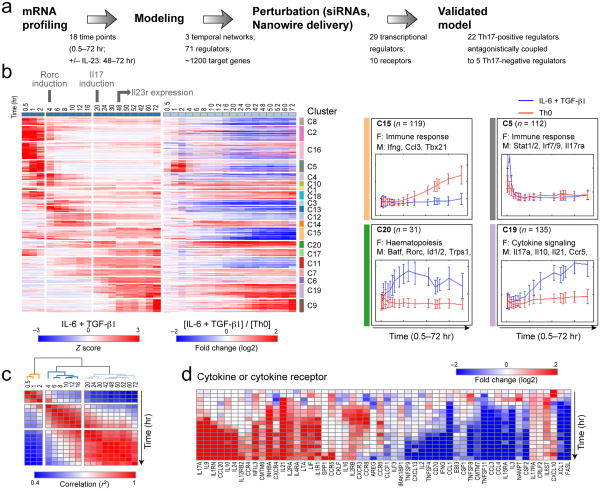
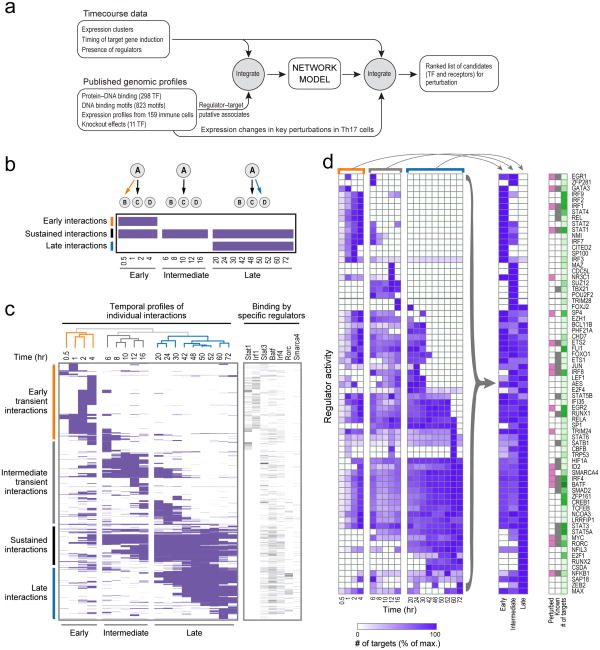
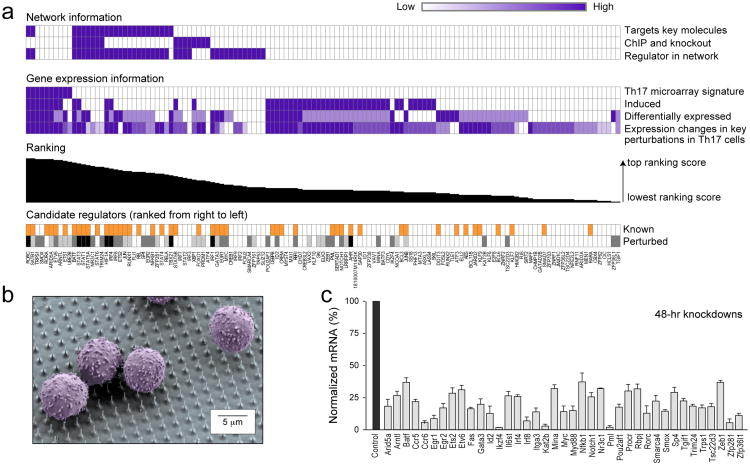
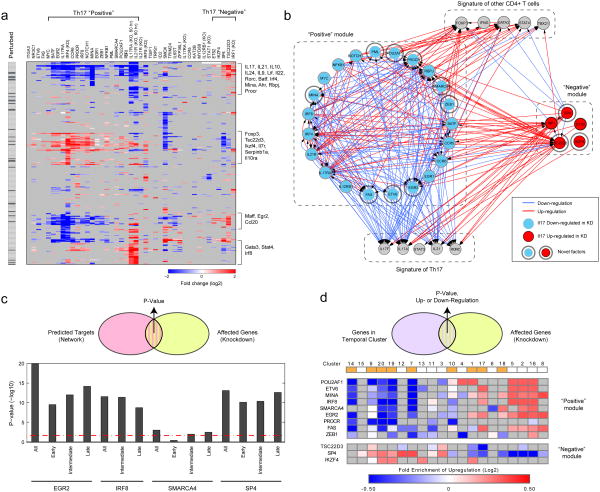
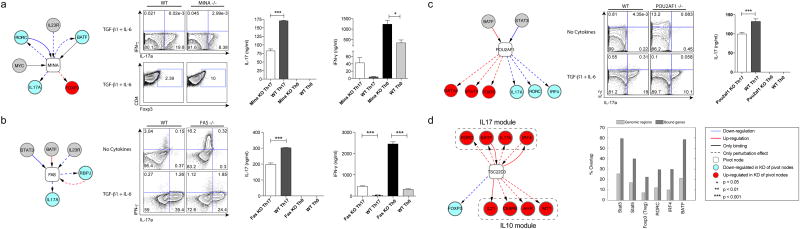
Despite their importance, the molecular circuits that control the differentiation of naive T cells remain largely unknown. Recent studies that reconstructed regulatory networks in mammalian cells have focused on short-term responses and relied on perturbation-based approaches that cannot be readily applied to primary T cells. Here we combine transcriptional profiling at high temporal resolution, novel computational algorithms, and innovative nanowire-based perturbation tools to systematically derive and experimentally validate a model of the dynamic regulatory network that controls the differentiation of mouse TH17 cells, a proinflammatory T-cell subset that has been implicated in the pathogenesis of multiple autoimmune diseases. The TH17 transcriptional network consists of two self-reinforcing, but mutually antagonistic, modules, with 12 novel regulators, the coupled action of which may be essential for maintaining the balance between TH17 and other CD4(+) T-cell subsets. Our study identifies and validates 39 regulatory factors, embeds them within a comprehensive temporal network and reveals its organizational principles; it also highlights novel drug targets for controlling TH17 cell differentiation.


Figures

Figure 1
Figure 1. Genome wide temporal expression profiles of Th17 differentiation
(a) Overview of approach. (b) Gene expression profiles during Th17 differentiation. Shown are the differential expression levels for genes (rows) at 18 time points (columns) in Th17 polarizing conditions (TGF-β1 and IL-6; left panel, Z-normalized per row) or Th17 polarizing conditions relative to control activated Th0 cells (right panel, log2(ratio)). The genes are partitioned into 20 clusters (C1-C20, color bars, right). Right: mean expression (Y axis) and standard deviation (error bar) at each time point (X axis) for genes in representative clusters. Cluster size (“n”), enriched functional annotations (“F”), and representative genes (“M”) are denoted. (c) Three major transcriptional phases. Shown is a correlation matrix (red: high; blue: low) between every pair of time points. (d) Transcriptional profiles of key cytokines and cytokine receptors.
Figure 2
Figure 2. A model of the dynamic regulatory network of Th17 differentiation
(a) Overview of computational analysis. (b) Schematic of temporal network ‘snapshots’. Shown are three consecutive cartoon networks (top and matrix columns), with three possible interactions from regulator (A) to targets (B, C & D), shown as edges (top) and matrix rows (A→B – top row; A→C – middle row; A→D – bottom row). (c) 18 network ‘snapshots’. Left: each row corresponds to a TF-target interaction that occurs in at least one network; columns correspond to the network at each time point. A purple entry: interaction is active in that network. The networks are clustered by similarity of active interactions (dendrogram, top), forming three temporally consecutive clusters (early, intermediate, late, bottom). Right: a heatmap denoting edges for selected regulators. (d) Dynamic regulator activity. Shown is, for each regulator (rows), the number of target genes (normalized by its maximum number of targets) in each of the 18 networks (columns, left), and in each of the three canonical networks (middle) obtained by collapsing (arrows). Right: regulators chosen for perturbation (pink), known Th17 regulators (grey), and the maximal number of target genes across the three canonical networks (green, ranging from 0 to 250 targets).
Figure 3
Figure 3. Knockdown screen in Th17 differentiation using silicon nanowires
(a) Unbiased ranking of perturbation candidates. Shown are the genes ordered from left to right based on their ranking for perturbation (columns, top ranking is leftmost). Two top matrices: criteria for ranking by ‘Network Information’ (topmost) and ‘Gene Expression Information’. Purple entry: gene has the feature (intensity proportional to feature strength; top five features are binary). Bar chart: ranking score. ‘Perturbed’ row: dark grey: genes successfully perturbed by knockdown followed by high quality mRNA quantification; light grey: genes we attempted to knockdown but could not achieve or maintain sufficient knockdown or did not obtain enough replicates; Black: genes we perturbed by knockout or for which knockout data was already available. Known row: orange entry: a gene was previously associated with Th17 function (this information was not used to rank the genes; Supplementary Fig. 6). (b) Scanning electron micrograph of primary T cells (false colored purple) cultured on vertical silicon nanowires. (c) Effective knockdown by siRNA delivered on nanowires. Shown is the % of mRNA remaining after knockdown (by qPCR, Y axis: mean ± standard error relative to non-targeting siRNA control, n = 12, black bar on left) at 48hrs after introduction of polarizing cytokines.
Figure 4
Figure 4. Coupled and mutually-antagonistic modules in the Th17 network
(a) Impact of perturbed genes on a 275-gene signature. Shown are changes in the expression of 275 signature genes (rows) following knockdown or knockout (KO) of 39 factors (columns) at 48hr (as well as IL-21r and IL-17ra KO at 60 hours). Blue: decreased expression of target following perturbation of a regulator (compared to a non-targeting control); red: increased expression; Grey: not significant; all color entries are significant (Methods). ‘Perturbed’ (left): signature genes that are also perturbed as regulators (black entries). Key signature genes are denoted on right. (b) Two coupled and opposing modules. Shown is the perturbation network associating the ‘positive regulators’ (blue nodes) of Th17 signature genes, the ‘negative regulators’ (red nodes), Th17 signature genes (grey nodes, bottom) and signature genes of other CD4+ T cells (grey nodes, top). A blue edge from node A to B indicates that knockdown of A downregulates B; a red edge indicates that knockdown of A upregulates B. Light grey halos: regulators not previously associated with Th17 differentiation. (c) Knockdown effects validate edges in network model. Venn diagram: we compare the set of targets for a factor in the original model of Fig. 2a (pink circle) to the set of genes that respond to that factor's knockdown in an RNA-Seq experiment (yellow circle). Bar chart on bottom: Shown is the -log10(P-value) (Y axis, hypergeometric test) for the significance of this overlap for four factors (X axis). Similar results were obtained with a non-parametric rank-sum test (Mann-Whitney U test, Methods). Red dashed line: P=0.01. (d) Global knockdown effects are consistent across clusters. Venn diagram: we compare the set of genes that respond to a factor's knockdown in an RNA-Seq experiment (yellow circle) to each of the 20 clusters of Fig. 1b (purple circle). We expect the knockdown of a ‘Th17 positive’ regulator to repress genes in induced clusters, and induce genes in repressed clusters (and vice versa for ‘Th17 negative’ regulators). Heat map: For each regulator knockdown (rows) and each cluster (columns) shown are the significant overlaps (non grey entries) by the test above. Red: fold enrichment for up-regulation upon knockdown; Blue: fold enrichment for down regulation upon knockdown. Orange entries in the top row indicate induced clusters.
Figure 5
Figure 5. Mina, Fas, Pou2af1, and Tsc22d3 are key novel regulators affecting the Th17 differentiation programs. (a-d, left)
Shown are regulatory network models centered on different pivotal regulators (square nodes): (a) Mina, (b) Fas, (c) Pou2af1, and (d) Tsc22d3. In each network, shown are the targets and regulators (round nodes) connected to the pivotal nodes based on perturbation (red and blue dashed edges), TF binding (black solid edges), or both (red and blue solid edges). Genes affected by perturbing the pivotal nodes are colored (blue: target is down-regulated by knockdown of pivotal node; red: target is up-regulated). (a-c, middle and right) Intracellular staining and cytokine assays by ELISA or Cytometric Bead Assays (CBA) on culture supernatants at 72h of in vitro differentiated cells from respective KO mice activated in vitro with anti-CD3 + anti-CD28 with or without Th17 polarizing cytokines (TGF-β + IL-6). (d, middle) ChIP-Seq of Tsc22d3. Shown is the proportion of overlap in bound genes (dark grey) or bound regions (light grey) between Tsc22d3 and a host of Th17 canonical factors (X axis). All results are statistically significant (P<10-6; Methods).

Comment in

References

    1. Bettelli E, Oukka M, Kuchroo VK. T(H)-17 cells in the circle of immunity and autoimmunity. Nat Immunol. 2007;8:345–350. doi: 10.1038/ni0407-345. - DOI - PubMed
    1. Zhou L, et al. TGF-beta-induced Foxp3 inhibits T(H)17 cell differentiation by antagonizing RORgammat function. Nature. 2008;453:236–240. nature06878 [pii]10.1038/nature06878. - PMC - PubMed
    1. O'Shea J, et al. Signal transduction and Th17 cell differentiation. Microbes Infect. 2009;11:599–611. - PMC - PubMed
    1. Zhou L, Littman D. Transcriptional regulatory networks in Th17 cell differentiation. Curr Opin Immunol. 2009;21:146–152. - PMC - PubMed
    1. Korn T, Bettelli E, Oukka M, Kuchroo VK. IL-17 and Th17 Cells. Annu Rev Immunol. 2009;27:485–517. doi: 10.1146/annurev.immunol.021908.13271010.1146/annurev.immunol.021908.132710[pii]. - DOI - PubMed

Publication types

MeSH terms

Associated data