. 2013 Mar 14;495(7440):193-8.
doi: 10.1038/nature11968. Epub 2013 Mar 6.

Patterns of population epigenomic diversity

Affiliations

Patterns of population epigenomic diversity

Robert J Schmitz et al. Nature. .

Abstract

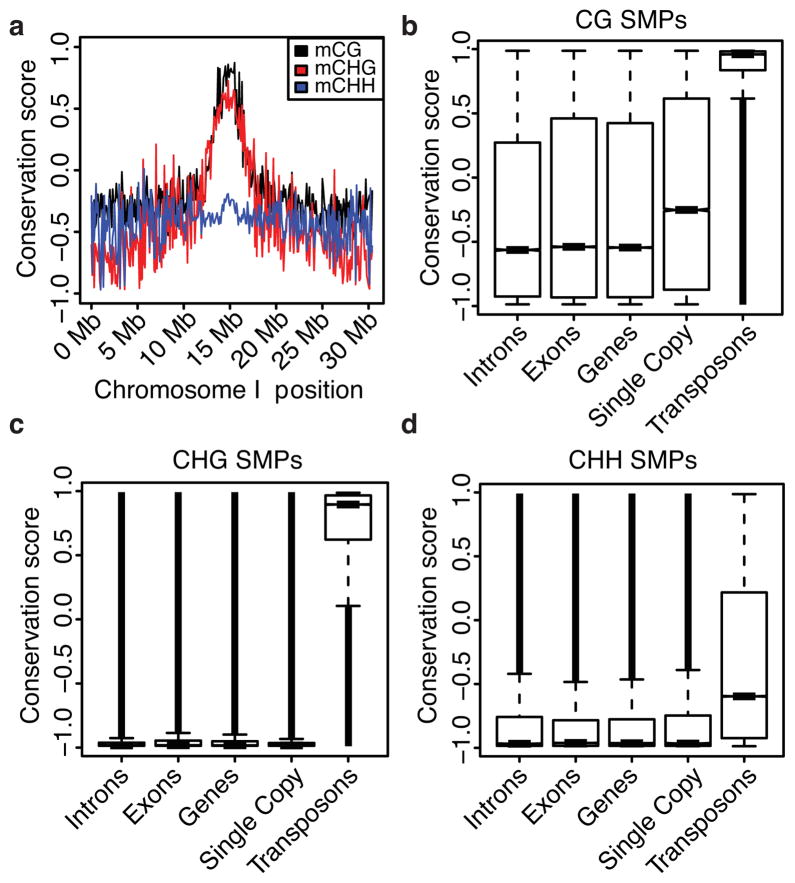
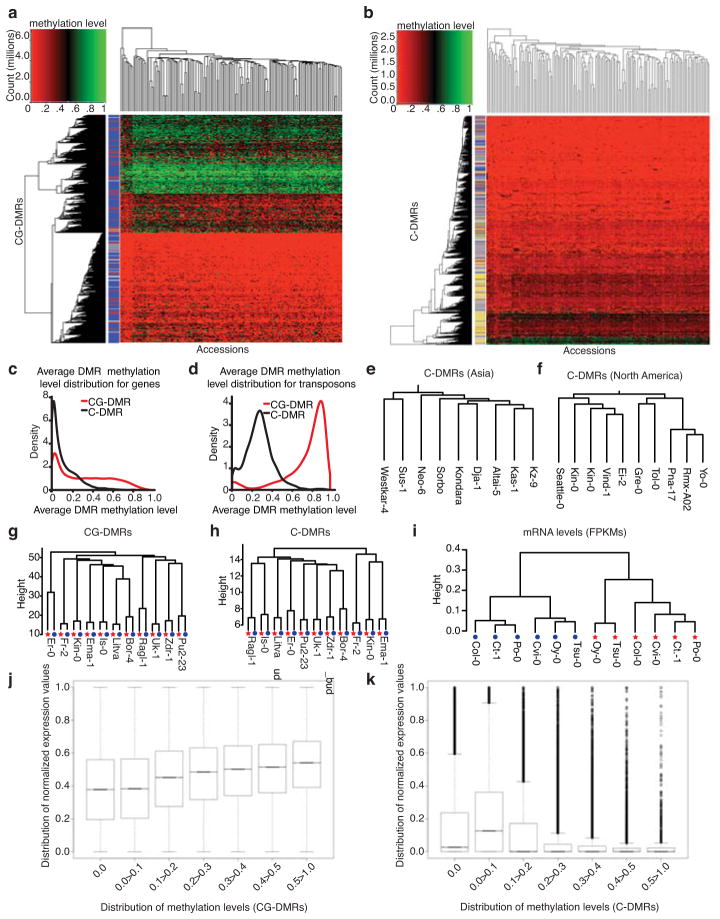
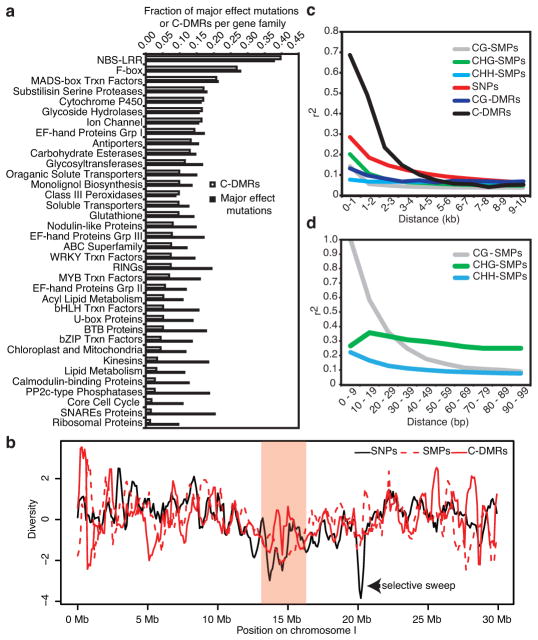
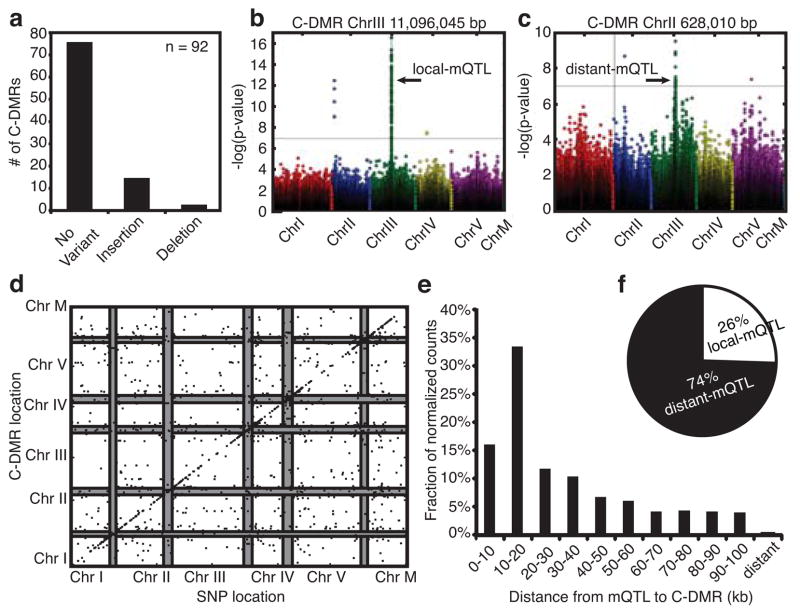
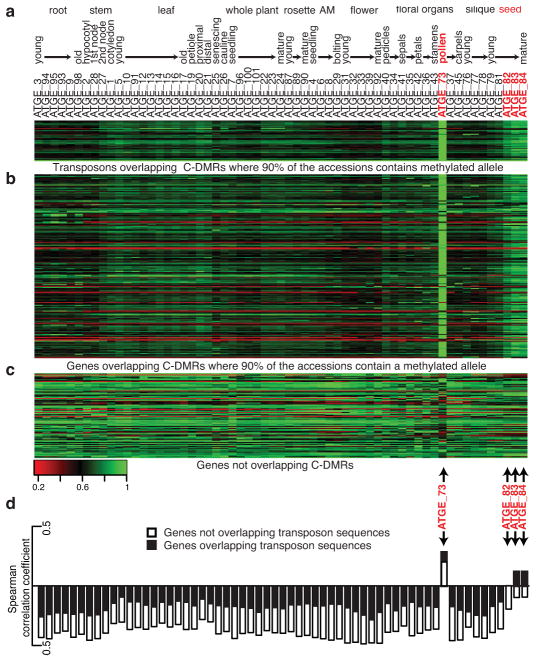
Natural epigenetic variation provides a source for the generation of phenotypic diversity, but to understand its contribution to such diversity, its interaction with genetic variation requires further investigation. Here we report population-wide DNA sequencing of genomes, transcriptomes and methylomes of wild Arabidopsis thaliana accessions. Single cytosine methylation polymorphisms are not linked to genotype. However, the rate of linkage disequilibrium decay amongst differentially methylated regions targeted by RNA-directed DNA methylation is similar to the rate for single nucleotide polymorphisms. Association analyses of these RNA-directed DNA methylation regions with genetic variants identified thousands of methylation quantitative trait loci, which revealed the population estimate of genetically dependent methylation variation. Analysis of invariably methylated transposons and genes across this population indicates that loci targeted by RNA-directed DNA methylation are epigenetically activated in pollen and seeds, which facilitates proper development of these structures.


Conflict of interest statement

The authors declare no competing financial interests.

Figures

Fig. 1
Fig. 1. Population-wide analyses of SMPs
(a) A plot of the genome-wide distribution of methylation conservation across chromosome I. (b–d) The distributions of SMP conservation scores across various genomic features. Notches in the boxplots represent bootstrap estimated 95% confidence intervals around the medians.
Fig. 2
Fig. 2. Population-wide analyses of DMRs
Heatmaps representing the methylation levels across CG-DMRs (a) and C-DMRs (b) with coverage in all 152 accessions. The colored row labels on the left of the heatmap indicate what feature a DMR falls in (blue = gene, gold = transposon, red = gene with a transposon inserted in an intron, grey = no feature). Rows indicate genomic locus of DMR and columns indicate accessions. The density (y-axis) and average methylation levels (x-axis) of CG-DMRs and C-DMRs in (c) genes and (d) transposons. Asian (e) and North American (f)) methylome profiles reflected geographical distribution. Dendrograms from hierarchical clustering of CG-DMRs (g), C-DMRs (h) and mRNA levels (i) from accessions that had samples from two different tissues. Red stars and blue circles indicate leaf and mixed stage inflorescence samples, respectively. (j) Boxplot representation of transcriptional variation reveals a positive association with higher levels of methylation levels of CG-DMRs. (k) Increasing methylation levels of C-DMRs is negatively associated with gene expression.
Fig. 3
Fig. 3. Population-wide analyses of natural genetic and epigenetic variation
(a) A comparison of genetic and epigenetic variation across gene families that have the highest incidence of C-DMRs. The y-axis indicates the gene family and the x-axis represents the relative fraction of major effect mutations or fraction of C-DMRs. Fractions were used to adjust for the size of the gene families. (b) A plot of SNP, SMP, and C-DMR diversity across chromosome I. The shaded pink region indicates the position of the pericentromere. (c and d) Linkage disequilibrium/positional association decay plots for genetic and epigenetic variants.
Fig. 4
Fig. 4. Association of natural genetic variants and methylation variants
(a) A summary of the type and number of variants (non-SNPs and small indels) discovered at 92 C-DMRs. Manhattan plots with examples of (b) local and (c) distant mQTL. (d) Distribution of significant mQTL and the C-DMRs with which they associate. Each point represents a significant association between a C-DMR and a block of SNPs. The x-axis denotes the genomic location of the SNP block, and the y-axis indicates the position of the C-DMR. The pericentromeres on each chromosome are shown as grey bars. (e) The distribution of distances of mQTL from their C-DMRs normalized for the base space covered by each range of distances. (f) The ratio of distant mQTL to local mQTL.
Fig. 5
Fig. 5. Epigenetic reprogramming of genes targeted by the RdDM pathway
(a–c) A heatmap representation of mRNA expression levels throughout a developmental time course for (a) transposons and (b) genes that overlap with C-DMRs where > 90% of the alleles are methylated across the population and (c) genes not overlapping with C-DMRs. Each row represents a locus with mRNA expression values. Each column represents a different developmental stage. mRNA expression values range from low (red) to medium (black) to high (green). (d) Correlation test between the nonCG methylation levels and microarray gene expression values for genes targeted by RdDM in Col-0. Open rectangles are genes that do not overlap transposon sequences; whereas black rectangles represent genes overlapping transposons sequences.

Comment in

References

    1. Calarco JP, et al. Reprogramming of DNA methylation in pollen guides epigenetic inheritance via small RNA. Cell. 2012;151:194–205. - PMC - PubMed
    1. Becker C, et al. Spontaneous epigenetic variation in the Arabidopsis thaliana methylome. Nature. 2011;480:245–249. - PubMed
    1. Schmitz RJ, et al. Transgenerational epigenetic instability is a source of novel methylation variants. Science. 2011;334:369–373. - PMC - PubMed
    1. Genereux DP, Miner BE, Bergstrom CT, Laird CD. A population-epigenetic model to infer site-specific methylation rates from double-stranded DNA methylation patterns. Proc Natl Acad Sci U S A. 2005;102:5802–5807. - PMC - PubMed
    1. Ossowski S, et al. The rate and molecular spectrum of spontaneous mutations in Arabidopsis thaliana. Science. 2010;327:92–94. - PMC - PubMed

Methods References

    1. Li L, et al. Linking photoreceptor excitation to changes in plant architecture. Genes Dev. 2012;26:785–790. - PMC - PubMed
    1. Langmead B, Trapnell C, Pop M, Salzberg SL. Ultrafast and memory-efficient alignment of short DNA sequences to the human genome. Genome Biol. 2009;10:R25. - PMC - PubMed
    1. Lister R, et al. Human DNA methylomes at base resolution show widespread epigenomic differences. Nature. 2009;462:315–322. - PMC - PubMed
    1. Storey JD. A direct approach to false discovery rates. Journal of the Royal Statistical Society. 2002;64:479–498.
    1. Breitling R, et al. Genetical genomics: spotlight on QTL hotspots. PLoS Genet. 2008;4:e1000232. - PMC - PubMed

Publication types

Associated data