Clinical Trial
. 2013 Mar 6;33(10):4594-604.
doi: 10.1523/JNEUROSCI.3381-12.2013.

Brain changes associated with postural training in patients with cerebellar degeneration: a voxel-based morphometry study

Affiliations
Clinical Trial

Brain changes associated with postural training in patients with cerebellar degeneration: a voxel-based morphometry study

Roxana Gabriela Burciu et al. J Neurosci. .

Abstract

Recent research indicates that physiotherapy can improve motor performance of patients with cerebellar degeneration. Given the known contributions of the cerebellum to motor learning, it remains unclear whether such observable changes in performance are mediated by the cerebellum or cerebral brain areas involved in motor control and learning. The current study addressed this question by assessing the increase in gray matter volume due to sensorimotor training in cerebellar patients using voxel-based morphometry. Nineteen human subjects with pure cerebellar degeneration and matched healthy controls were trained for 2 weeks on a balance task. Postural and clinical assessments along with structural magnetic resonance imaging were performed pretraining and post-training. The main findings were as follows. First, training enhanced balance performance in cerebellar patients. Second, in contrast to controls patients revealed significantly more post-training gray matter volume in the dorsal premotor cortex. Third, training-related increase in gray matter volume was observed within the cerebellum and was more pronounced in controls than in patients. However, statistically cerebellar changes were at the trend level and thus require additional, independent confirmation. We conclude that sensorimotor training of patients with cerebellar neurodegeneration induces gray matter changes primarily within nonaffected neocortical regions of the cerebellar-cortical loop. Residual function of the cerebellum appears to be exploited suggesting either a recovery from degeneration or intact processes of cerebellar plasticity in the remaining healthy tissue.


Figures

Figure 1.
Figure 1.
A, Schematic representation of the experimental design. B, LOS target layout. Participants were asked to displace their COG as smoothly and as far as possible to reach each cued location (gray color). On-line feedback of their COG trace was offered via a human-shaped cursor.
Figure 2.
Figure 2.
Performance of cerebellar patients and healthy controls on three LOS parameters: EPE (A), MXE (B), and DLC (C); expressed as mean scores. Error bars indicate SE. The three groups of bars indicate the main examinations: BT, AT, and A3. Below, scatter plots show a positive correlation of ICARS score with the EPE and MXE, and an inverse correlation with DCL.
Figure 3.
Figure 3.
Plots of the mean DCL score (A) and number of falls (B) of cerebellar patients and healthy controls during the 10 day assisted training. Error bars indicate SE.
Figure 4.
Figure 4.
Mean sway length is shown across time, for each of the six SOT conditions. Error bars indicate SE.
Figure 5.
Figure 5.
Standard whole-brain VBM analysis results showing increase in gray matter volume from before training to after training in cerebellar patients (left) and healthy controls (right). Training-related gray matter volume increase in patients was detected in the right PMd (A) at p < 0.05 (FWE corrected; shown in green). B, At a trend level (p < 0.001, uncorrected; predetermined cluster size of 48.29 as partial correction; shown in red), gray matter volume increase was seen in the left middle temporal gyrus, insula bilaterally, and left anterior cingulate cortex. C, Conversely, increase in gray matter volume in controls was seen in the calcarine sulcus bilaterally, right superior temporal gyrus, right middle occipital gyrus, left putamen, left hippocampus, and right lobule VIIIb of the cerebellum (D) (p < 0.001, uncorrected; predetermined cluster size of 48.29 as partial correction; shown in red). Gray matter changes are overlaid on a mean image of the modulated normalized gray matter segments. Color scales indicate t values, whereas x, y, z stand for the MNI coordinates in millimeters. GM, gray matter; PMd, dorsal premotor cortex; MTG, middle temporal gyrus; INS, insula; ACC, anterior cingulate cortex; CaS, calcarine sulcus; STG, superior temporal gyrus; MOG, middle occipital gyrus; PUT, putamen; HC, hippocampus; VIIIb, cerebellar lobule VIIIb.
Figure 6.
Figure 6.
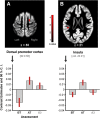
Group analysis showing brain regions where patients had more gray matter volume increase from before training to after training than healthy controls: PMd (A) and insula (B). Bottom plot displays changes over time based on β parameter estimates (with 90% confidence interval) of the peak voxel within the respective clusters (B). Note that these plots are meant for illustration purposes only. The statistical parametric maps are overlaid on the mean image of the modulated normalized gray matter segments and thresholded at p < 0.001 (uncorrected; predetermined cluster size of 48.29 as partial correction). Color scale indicates t values, whereas the z coordinates represent the MNI coordinates. GM, gray matter.
Figure 7.
Figure 7.
The cerebellum-optimized VBM analysis demonstrated training-related gray matter volume increase in patients in the right Crus I (top). In controls, gray matter volume increase in the right lobules VI/Crus I, VIIIa/b is shown (bottom). Results are overlaid on the SUIT template and thresholded at p < 0.001 (uncorrected; predetermined cluster size of 30.78 as partial correction). Color bar indicates t values. Y values indicate the coordinate in millimeters, in SUIT space. GM, gray matter.
Figure 8.
Figure 8.
Areas of reduced baseline gray matter volume in cerebellar patients compared with controls (A). Cerebellar structures that negatively correlated at baseline with the patients' degree of ataxia (SARA scores) (B). Cerebral structures that showed a positive correlation at baseline with the patients' SARA scores (C, red). For direct comparison, training-related gray matter volume increase is shown in green (C, green). Results are overlaid on the SUIT template/mean image of the modulated normalized gray matter segments. The statistical threshold was set at p < 0.001 (uncorrected; predetermined cluster size of 54.89 for cerebellar structures and 34.13 for cerebral structures as partial correction). Color bars represent t values. The number at the bottom of each image indicates the coordinate in millimeters, in SUIT/ MNI space.

References

    1. Anheim M, Tranchant C, Koenig M. The autosomal recessive cerebellar ataxias. N Engl J Med. 2012;366:636–646. - PubMed
    1. Ashburner J, Friston KJ. Unified segmentation. Neuroimage. 2005;26:839–851. - PubMed
    1. Beauchamp MS, Lee KE, Haxby JV, Martin A. Parallel visual motion processing streams for manipulable objects and human movements. Neuron. 2002;34:149–159. - PubMed
    1. Beauchamp MS, Lee KE, Haxby JV, Martin A. FMRI responses to video and point-light displays of moving humans and manipulable objects. J Cogn Neurosci. 2003;15:991–1001. - PubMed
    1. Bennett CM, Wolford GL, Miller MB. The principled control of false positives in neuroimaging. Soc Cogn Affect Neurosci. 2009;4:417–422. - PMC - PubMed

Publication types

MeSH terms