. 2013 Jun 1;304(11):F1347-57.
doi: 10.1152/ajprenal.00717.2012. Epub 2013 Mar 6.

HIV compromises integrity of the podocyte actin cytoskeleton through downregulation of the vitamin D receptor

Affiliations

HIV compromises integrity of the podocyte actin cytoskeleton through downregulation of the vitamin D receptor

Nirupama Chandel et al. Am J Physiol Renal Physiol. .

Abstract

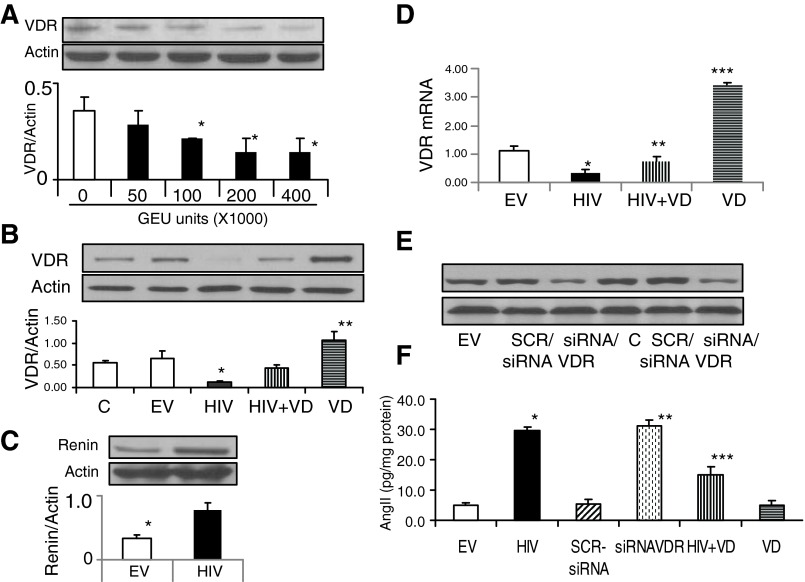
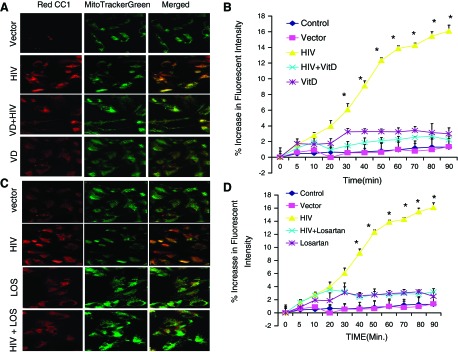
Alterations in the podocyte actin cytoskeleton have been implicated in the development of proteinuric kidney diseases. In the present study, we evaluated the effect of HIV on the podocyte actin cytoskeleton and the mechanism involved. We hypothesized that HIV may be compromising the actin cytoskeleton via downregulation of the vitamin D receptor (VDR) of conditionally immortalized differentiated human podocytes (CIDHPs). HIV-transduced podocytes (HIV/CIDHPs) not only displayed downregulation of VDR but also showed activation of the renin-angiotensin system (RAS) in the form of enhanced expression of renin and increased production of ANG II. Moreover, CIDHPs lacking VDR displayed enhanced ANG II production, and treatment of HIV/CIDHPs with EB1089 (vitamin D3; VD) attenuated ANG II production. HIV/CIDHPs as well as ANG II-treated CIDHPs exhibited enhanced expression of cathepsin (CTS) L. Additionally, losartan (an ANG II type I receptor blocker) inhibited both HIV- and ANG II-induced podocyte cathepsin L expression. Furthermore, VD downregulated HIV-induced podocyte CTSL expression. Both losartan and free radical scavengers attenuated HIV- and ANG II-induced podocyte reactive oxygen species (ROS) generation. HIV also led to cytosolic CTSL accumulation through enhancement of podocyte lysosomal membrane permeabilization; on the other hand, VD, losartan, and superoxide dismutase (SOD) attenuated HIV-induced enhanced podocyte cytosolic CTSL accumulation. Morphological evaluation of HIV/CIDHPs revealed sparse actin filaments and attenuated expression of dynamin. Interestingly, podocytes lacking CTSL displayed enhanced dynamin expression, and HIV/CIDHPs expressing CTSL exhibited downregulation of dynamin. These findings indicate that HIV-induced downregulation of podocyte VDR and associated RAS activation and cytosolic CTSL accumulation compromised the actin cytoskeleton.

Keywords: HIV-associated nephropathy; cathepsin L; podocyte; renin-angiotensin system; vitamin D receptor.


Figures

Fig. 1.
Fig. 1.
Human immunodeficiency virus (HIV) and podocyte vitamin D receptor (VDR) expression. A: conditionally immortalized differentiated human podocytes (CIDHPs) were transduced with NL4-3 [0, 50, 100, 200, and 400 (×1,000) GEU]; GEU refers to green-fluorescent protein (GFP)-expressing units. Transduced cells [empty vector (EV)/CIDHPs and HIV/CIDHPs] were incubated in serum-free media (SFM) for 24 h (n = 3). Cellular lysates were electrophoresed and probed for VDR and reprobed for actin. Cumulative densitometry data are shown in bar graphs. Inset: representative gel displaying dose-response effect of HIV on podocyte VDR expression. *P < 0.05 compared with 0 GEU. B: CIDHPs were pretreated with either buffer or EB1089 (10 nM, VD) for 4 h followed by transduction with either EV or NL4-3 and incubation in media for 24 h (n = 3). Protein blots were probed for VDR and reprobed for actin. Cumulative densitometric data are shown in bar graphs. Inset: representative gels displaying effect of VD on podocyte VDR expression under control and HIV-stimulated state. *P < 0.01 compared with control (C), EV, and HIV+VD. **P < 0.001 compared with HIV+VD. C: EV/CIDHPs and HIV/CIDHP were incubated in SFM for 24 h (n = 3). Subsequently, protein blots were probed for renin and reprobed for actin. Cumulative data are shown in the form of a bar diagram. Inset: representative gel displaying effect of HIV on podocyte renin expression. *P < 0.01 compared with HIV. D: EV/CIDHP and HIV/CIDHP were incubated in medium containing either buffer or EB1089 (10 nM) for 24 h (n = 4). Subsequently, total RNA was quantified for VDR by real-time PCR. *P < 0.01 compared with EV. **P < 0.05 compared with HIV. ***P < 0.001 compared with all other variables. E: EV/CIDHPs were transfected with scrambled (SCR)/small interfering (si) RNA or VDR/siRNA. Protein blots were probed for VDR and reprobed for actin (n = 2). Representative gel is displayed showing expression of VDR and actin in podocytes silenced for VDR. F: EV/CIDHPs were transfected with siRNA-VDR or SCR-siRNA. In parallel sets of experiments, EV/CIDHPs (C) or HIV/CIDHPs were incubated in media containing either EB1089 (10 nM) or buffer for 24 h (n = 3). At the end of the incubation period, cellular lysates were assayed for their ANG II content by ELISA. *P < 0.001 compared with EV, SCR-siRNA, and VD. **P < 0.001 compared with EV and SCR-siRNA. ***P < 0.01 compared with HIV.
Fig. 2.
Fig. 2.
Effect of HIV and VD on podocyte cathepsin L (CTSL) expression. A: EV/CIDHPs and HIV/CIDHPs were incubated in SFM for 24 h. Protein blots were probed for CTSL. The same blots were stripped and reprobed for actin. Inset: representative gels. Values are means ± SD from 3 sets of experiments are shown in the bar diagram. *P < 0.01 compared with HIV. B: CIDHPs were pretreated with either buffer or EB1089 (10 nM) for 4 h followed by transduction with either EV or HIV and then incubated in SFM for 24 h. Protein blots were probed for CTSL. The same blots were stripped and reprobed for actin (n = 3). Cumulative densitometry data are shown in bar graphs. Inset: representative gels. *P < 0.001 compared with C and EV. **P < 0.01 compared with HIV. C: CIDHPs were pretreated with either buffer or EB1089 (10 nM) for 4 h followed by transduction with either EV or HIV and then incubated in SFM for 24 h. Total RNA was extracted, and mRNA expression was quantified by real-time PCR (n = 3). *P < 0.001 compared with all other variables. D: EV/CIDHPs or HIV/CIDHPs were incubated in SFM containing either buffer or SOD (500 U/ml) for 24 h (n = 3). Cellular lysates were electrophoresed and probed for CTSL. The same blots were stripped and reprobed for actin. Cumulative densitometry data are shown in bar graphs. Representative gels are shown. *P < 0.001 compared with EV. **P < 0.01 compared with HIV.
Fig. 3.
Fig. 3.
Role of VDR and ANG II on HIV-induced reactive oxygen species (ROS) generation. A: EV/CIDHPs and HIV/CIDHPs were incubated in SFM containing either buffer or EB1089 (10 nM, VD) for 4 h and then colabeled with Red CC1 and MitoTracker green. Subsequently, cells were examined under a confocal microscope. Representative microphotographs display mitochondrial localization (green), ROS generation (red), and combined (orange fluorescence) images. HIV stimulated predominantly mitochondrial ROS generation (orange fluorescence). HIV/VD/CIDHPs displayed diminished mitochondrial ROS generation compared with HIV/CIDHPs. B: EV/CIDHPs and HIV/CIDHPs were loaded with DCFDA and then treated with either buffer or EB1089 (10 nM, VD), followed by measurement of ROS generation at the indicated time periods (n = 3). *P < 0.01 compared with other variables. C: EV/CIDHPs and HIV/CIDHPs were incubated in medium containing either buffer or losartan (10−7 M; LOS) for 24 h (n = 3). Subsequently, cells were colabeled with Red CC1 and MitoTracker green. Representative microphotographs are shown. HIV stimulated mitochondrial ROS generation (orange fluorescence in merged pictures). However, losartan inhibited HIV-induced mitochondrial ROS generation. D: EV/CIDHPs, HIV/CIDHPs, and CIDHPs were loaded with DCFDA for 30 min. Cells were washed and treated with either buffer, or losartan (10−7 M) followed by measurement of ROS generation (at every 10 min) by a fluorometer. *P < 0.01 compared with all other variables.
Fig. 4.
Fig. 4.
Effect of ANG II on podocyte ROS generation and CTSL expression. A: CIDHPs were incubated in SFM containing either buffer, ANG II (10−8 M), LOS (10−7 M), or LOS+ANG II for 24 h (n = 3). Subsequently, cells were colabeled with Red CC1 and MitoTracker green and examined under a confocal microscope. Representative microphotographs of control and experimental cells are shown. ANG II enhanced mitochondrial ROS generation (orange fluorescence). However, losartan inhibited ANG II-induced podocyte ROS generation. B: CIDHPs were loaded with DCFDA for 30 min, and then DCFDA was washed out. Cells were treated with either buffer, ANG II (10−8 M), LOS (10−7 M), or LOS+ANG II (n = 3). Subsequently, ROS generation was measured by a fluorometer. *P < 0.01 compared with all other variables. C: CIDHPs were loaded with DCFDA for 30 min, and then DCFDA was washed out. Cells were treated with either buffer, ANG II (10−8 M), catalase (500 U), or catalase+ANG II (n = 3) followed by measurement of ROS at the indicated time points. *P < 0.01 compared with other variables. D: CIDHPs were incubated in SFM containing buffer or ANG II (10−8 M), LOS (10−7 M), or LOS+ANG II for 24 h (n = 3). Cellular lysates were electrophoresed and probed for CTSL and reprobed for actin. Cumulative densitometry data are shown in bar graphs. Representative gels of podocyte expressing CTSL under control and experimental conditions are shown. *P < 0.01 compared with control and LOS. **P < 0.05 compared with ANG II alone.
Fig. 5.
Fig. 5.
Effect of HIV and ANG II on podocyte cytosolic CTSL accumulation. A: EV/CIDHPs and HIV/CIDHPs grown on 12-well plates were incubated in SFM containing either buffer, ANG II (10−8 M), LOS (10−7 M), EB1089 (10 nM, VD), LOS+ANG II, or SOD (500 U/ml) for 24 h (n = 3). Subsequently, cells were labeled with magic red and examined under a fluorescence microscope. Representative microphotographs are shown. Cytoplasmic CTSL expression is indicated by bright red fluorescence. Nuclei are stained blue (H33342). B: cumulative data in bar graphs display percentage of cells exhibiting cytosolic red fluorescence under control and experimental conditions (as mentioned in A). *P < 0.001 compared with EV and VD. **P < 0.001 compared with HIV. ***P < 0.001 compared with LOS alone, LOS+ANG II, and SOD+ANG II.
Fig. 6.
Fig. 6.
Effect of free radical scavengers on HIV-induced podocyte ROS generation and the role of ROS in HIV-induced enhanced lysosomal membrane permeabilization (LMP). A: CIDHPs, EV/CIDHPs, or HIV/CIDHPs were loaded with 2′,7′-dichlorofluorescein diacetate (DCFDA). After 30 min, cells were washed and treated with either buffer or SOD (500 U/ml) followed by measurement of ROS by a fluorometer (n = 3). *P < 0.01 compared with other variables. B: EV/CIDHPs, or HIV/CIDHPs were loaded with DCFDA. After 30 min, cells were washed and treated with either buffer or catalase (500 U/ml) followed by measurement of ROS by a fluorometer (n = 3). *P < 0.01 compared with all other variables. C: EV/CIDHPs (Control) and HIV/CIDHPs (HIV) were incubated in SFM containing either buffer or d-sphingosine (40 μg/ml, as a positive control) and then labeled with lysotracker (Lucifer yellow) and examined under a confocal microscope (n = 3). Representative microphotographs of individual cells are shown. A control cell showed intact lysosomes (punctate lysotracker labeling). An individual cell transduced with HIV or treated with sphingosine (positive control) displayed leakage of the dye into the cytosol (increase in lysotracker-labeled area).
Fig. 7.
Fig. 7.
VD attenuates HIV-induced disruption of podocyte actin cytoskeleton. A: EV/CIDHPs and HIV/CIDHPs were colabeled with phalloidin and nuclear stain 4′-6-diamidino-2-phenylindole (DAPI; n = 3). EV/CIDHPs displayed bright fluorescence, indicating intact actin filaments and well-spread cells. HIV/CIDHPs displayed fewer actin filaments and loss of spreading compared with EV/CIDHPs. B: EV/CIDHPs, EV/VD/CIDHPs, HIV/CIDHPS, and HIV/VD/CIDHPs were labeled with phalloidin and DAPI and then examined under a fluorescence microscope (n = 3). Representative microphotographs are shown as insets. The cortical F-actin score (CFS) index was calculated under control and experimental conditions. HIV/CIDHPs displayed an increased CFS index compared with EV/CIDHPs. *P < 0.001 compared with control and VD. **P < 0.01 compared with HIV alone.
Fig. 8.
Fig. 8.
Role of dynamin and CTSL in actin dynamics. A: EV/CIDHPs and HIV/CIDHPs were colabeled with anti-dynamin antibody and phalloidin and examined under a fluorescence microscope (n = 3). Representative microphotographs are shown. HIV/CIDHPs displayed fewer actin filaments and diminished expression of dynamin. B: CIDHPs were pretreated with EB1089 (10 nM, VD) for 4 h followed by transduction with either EV (control) or HIV and incubated in SFM for 24 h (n = 3). Subsequently, cells were immunolabeled for dynamin and phalloidin and examined under a fluorescence microscope. Representative microphotographs of podocyte under control and experimental conditions are shown. HIV/CIDHPs displayed diminished dynamin expression; VD preserved dynamin expression in HIV/CIDHPs.
Fig. 9.
Fig. 9.
Effect of lack of CTSL on podocyte dynamin expression under control and HIV milieu. A: cellular lysates of EV/CIDHPs transfected with SCR-siRNA, CTSL/siRNA, and HIV/CIDHPs were probed for CTSL. The same blots were reprobed for dynamin and actin. Representative gels from 2 sets of experiments are shown. B: cumulative data of 3 sets of experiments (experimental conditions described in A). *P < 0.05 compared with EV and SCR-siRNA. **P < 0.05 vs. CTSL/siRNA. C: cumulative data of 3 sets of experiments (experimental conditions described in A). *P < 0.05 compared with EV, SCR-siRNA, and HIV.

Similar articles

Cited by

References

    1. Atta MG, Lucas GM, Fine DM. HIV-associated nephropathy: epidemiology, pathogenesis, diagnosis and management. Expert Rev Anti Infect Ther 6: 365–371, 2008 - PubMed
    1. Barisoni L, Kriz W, Mundel P, D'agati V. The dysregulated podocyte phenotype: a novel concept in the pathogenesis of collapsing idiopathic focal segmental glomerulosclerosis and HIV-associated nephropathy. J Am Soc Nephrol 10: 51–61, 1999 - PubMed
    1. Becker BN, Yasuda T, Kondo S, Vaikunth S, Homma T, Harris RC. Mechanical stretch/relaxation stimulates a cellular renin-angiotensin system in cultured rat mesangial cells. Exp Nephrol 6: 57–66, 1998 - PubMed
    1. Bird JE, Durham SK, Giancarli Gitliz PH, Pandya DG, Dambach DM, Mozes MM, Kopp JB. Captopril prevents nephropathy in HIV-transgenic mice. J Am Soc Nephrol 9: 1441–1447, 1998 - PubMed
    1. Burns GC, Paul SK, Toth IR, Sivak SL. Effect of angiotensin-converting enzyme inhibition in HIV-associated nephropathy. J Am Soc Nephrol 8: 1140–1146, 1997 - PubMed

Publication types

MeSH terms

LinkOut - more resources