. 2013 Jul-Aug;28(4):582-91.
doi: 10.1002/bio.2497. Epub 2013 Mar 6.

Dual-color-emitting green fluorescent protein from the sea cactus Cavernularia obesa and its use as a pH indicator for fluorescence microscopy

Affiliations
Free PMC article

Dual-color-emitting green fluorescent protein from the sea cactus Cavernularia obesa and its use as a pH indicator for fluorescence microscopy

Katsunori Ogoh et al. Luminescence. 2013 Jul-Aug.
Free PMC article

Abstract

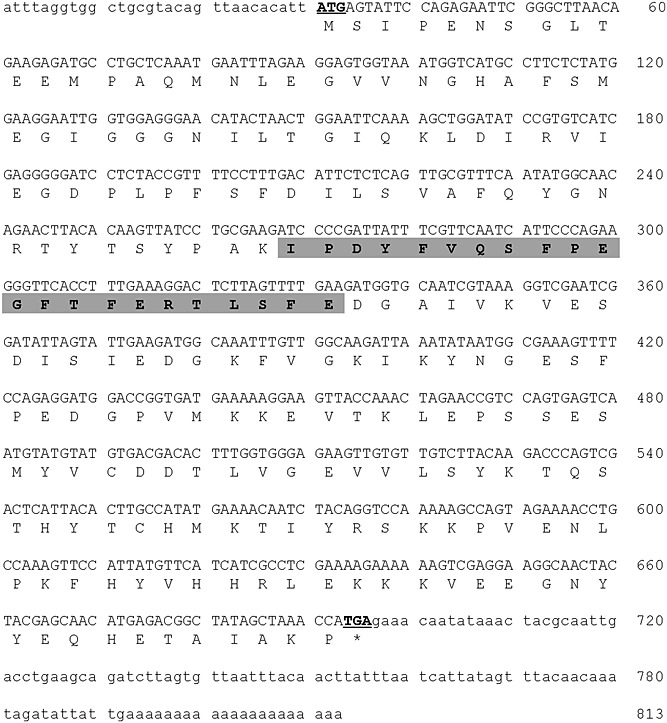
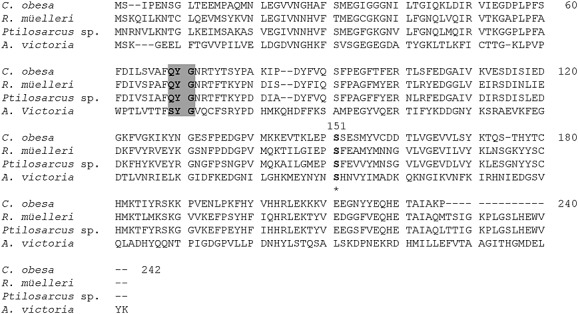
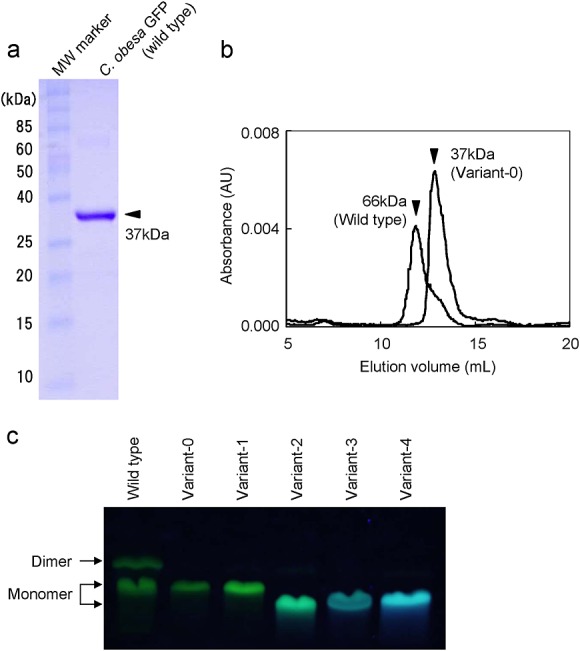
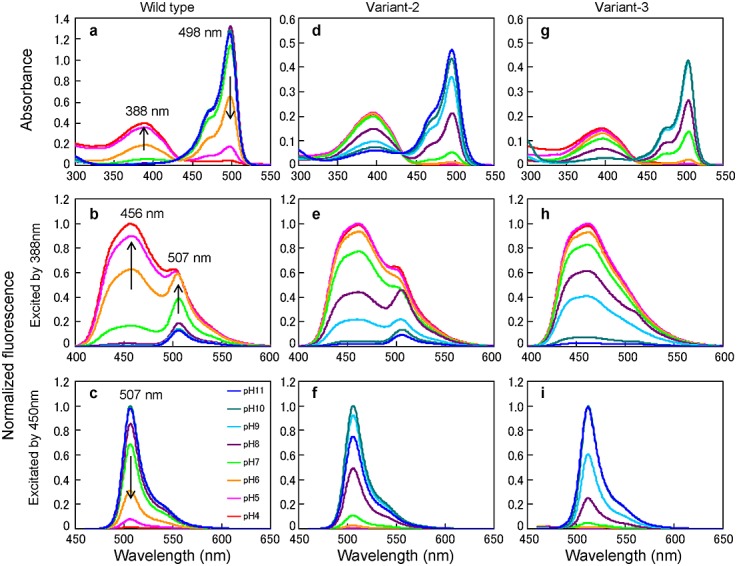
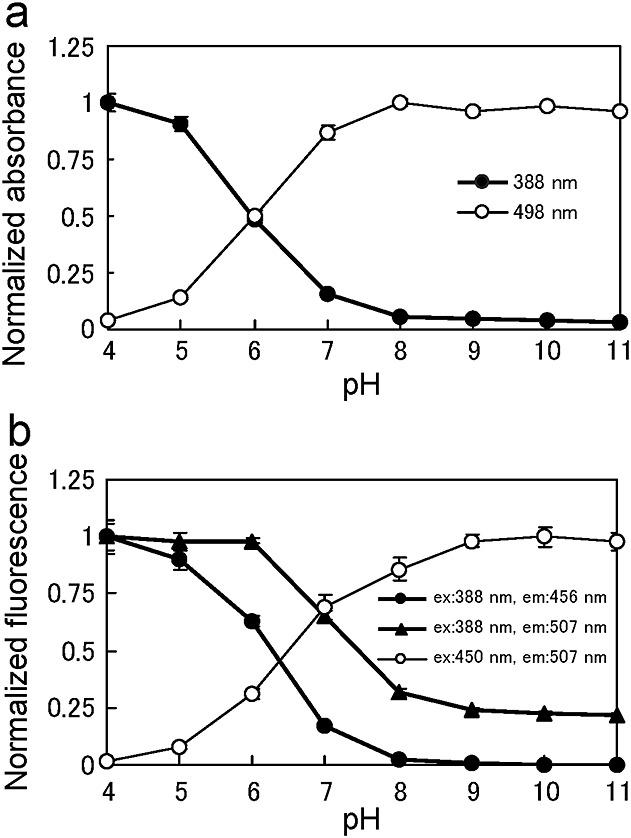
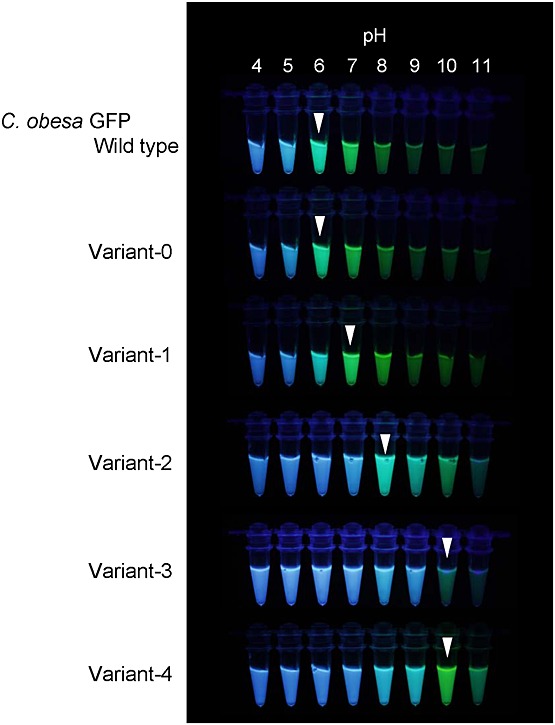
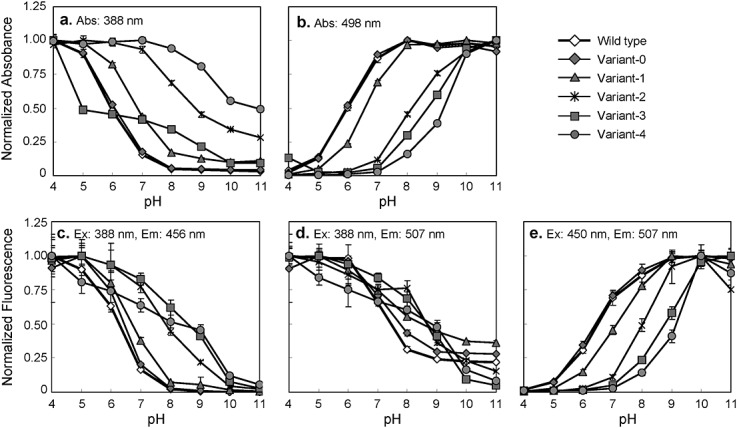
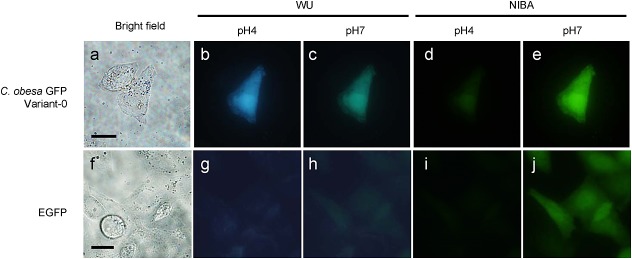
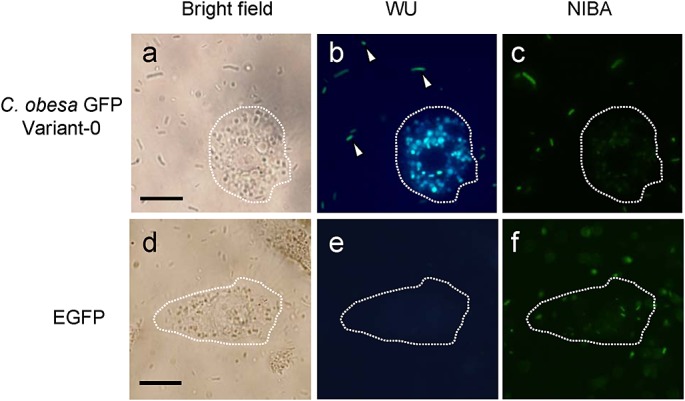
We isolated and characterized a green fluorescent protein (GFP) from the sea cactus Cavernularia obesa. This GFP exists as a dimer and has absorption maxima at 388 and 498 nm. Excitation at 388 nm leads to blue fluorescence (456 nm maximum) at pH 5 and below, and green fluorescence (507 nm maximum) at pH 7 and above, and the GFP is remarkably stable at pH 4. Excitation at 498 nm leads to green fluorescence (507 nm maximum) from pH 5 to pH 9. We introduced five amino acid substitutions so that this GFP formed monomers rather than dimers and then used this monomeric form to visualize intracellular pH change during the phagocytosis of living cells by use of fluorescence microscopy. The intracellular pH change is visualized by use of a simple long-pass emission filter with single-wavelength excitation, which is technically easier to use than dual-emission fluorescent proteins that require dual-wavelength excitation.

Keywords: GFP, dual-color emission; fluorescence microscopy; pH indicator; sea cactus.


Figures

Figure 1
Figure 1
cDNA nucleotide sequence and deduced amino acid sequence of Cavernularia obesa GFP (CoGFP). In the nucleotide sequence, upper case letters indicate the ORF, lower case letters indicate untranslated regions, and underlined upper case letters indicate the start and stop codons. The light-gray shading indicates a sequence identical to that determined by Edman degradation of the purified protein.
Figure 2
Figure 2
Comparison of the amino acid sequences of GFPs from Cavernularia obesa, Renilla mülleri, Ptilosarcus sp., and Aequorea victoria. Hyphens indicate gaps inserted to optimize the overall sequence alignment, the light-gray shading indicates the chromophore-forming tripeptide, and the asterisk indicates the Ser at position 147 of A. victoria GFP.
Figure 3
Figure 3
Apparent molecular mass of wild-type CoGFP and of five CoGFP variants. Molecular mass determination of wild-type CoGFP by 10% SDS/PAGE (a), size-exclusion chromatography of the wild-type and variant-0 CoGFPs (b) and identification of monomeric and dimeric forms in wild-type and variants by 14% pseudo-native SDS/PAGE under 362 nm excitation (c).
Figure 4
Figure 4
Absorption spectra (a,d,g) and normalized fluorescence spectra during 388 nm excitation (b,e,h) and 450 nm excitation (c,f,i) at pH 4 to 11 (mean of three replicates) in wild-type CoGFP (a,b,c), variant-2 CoGFP (d,e,f), and variant-3 CoGFP (g,h,i). Arrows show the effect of decreasing pH.
Figure 5
Figure 5
Effect of pH on the absorption maxima (388, 498 nm) (a) and fluorescence maxima (456, 507, 388 nm excitation; 507, 450 nm excitation) of wild-type CoGFP (b) (mean ± SD, N = 3).
Figure 6
Figure 6
Fluorescence of wild-type CoGFP and of five CoGFP variants excited by 362 nm using a handy UV-lamp in Eppendorf tubes at pH 4 to 11. Each arrowhead indicates the transition from blue to green fluorescence.
Figure 7
Figure 7
Effect of pH on absorption (Abs.) at 388 nm (a) or 498 nm (b) and fluorescence emission (Em.) at 456 nm (388 nm excitation, Ex.) (c), 507 nm (388 nm excitation) (d), and 507 nm (450 nm excitation) (e) of wild-type CoGFP and of five variant CoGFPs (mean ± SD, N = 3).
Figure 8
Figure 8
Bright-field (a,f) and fluorescence (b–e,g–j) images of HeLa cells transiently expressing variant-0 CoGFP and EGFP. Fluorescence images were captured by WU and NIBA mirror units at pH 4 and pH 7. Scale bars, 20 µm.
Figure 9
Figure 9
Bright-field (a,d) and fluorescence (b,c,e,f) microscopy of macrophages (RAW264.7) feeding on E. coli that expressed variant-0 CoGFP and EGFP. Fluorescence images were captured by the WU and NIBA mirror units. The dotted line in each image outlines a RAW264.7 cell, and arrowheads indicate E. coli cells. Scale bars, 20 µm.

Similar articles

Cited by

References

    1. Haddock SHD, Moline MA, Case JF. Bioluminescence in the sea. Annu Rev Mar Sci. 2010;2:443–93. - PubMed
    1. Shimomura O. Bioluminescence: chemical principles and methods. Singapore: World Scientific Publishing; 2006.
    1. Tsien RY. The green fluorescent protein. Annu Rev Biochem. 1998;67:509–44. - PubMed
    1. Miyawaki A, Llopis J, Heim R, McCaffery JM, Adams JA, Ikura M, et al. Fluorescent indicators for Ca2+ based on green fluorescent proteins and calmodulin. Nature. 1997;388:882–7. - PubMed
    1. Baird GS, Zacharias DA, Tsien RY. Circular permutation and receptor insertion within green fluorescent proteins. Proc Natl Acad Sci USA. 1999;96:11241–6. - PMC - PubMed

Substances

Associated data

LinkOut - more resources