. 2014 Mar;219(2):607-30.
doi: 10.1007/s00429-013-0522-x. Epub 2013 Mar 7.

The dorsal tectal longitudinal column (TLCd): a second longitudinal column in the paramedian region of the midbrain tectum

Affiliations

The dorsal tectal longitudinal column (TLCd): a second longitudinal column in the paramedian region of the midbrain tectum

M-Auxiliadora Aparicio et al. Brain Struct Funct. 2014 Mar.

Abstract

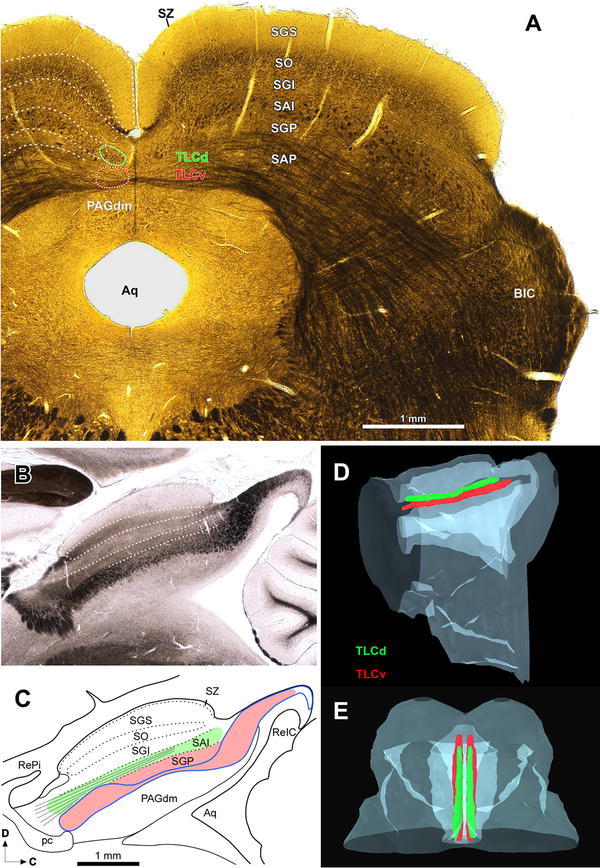
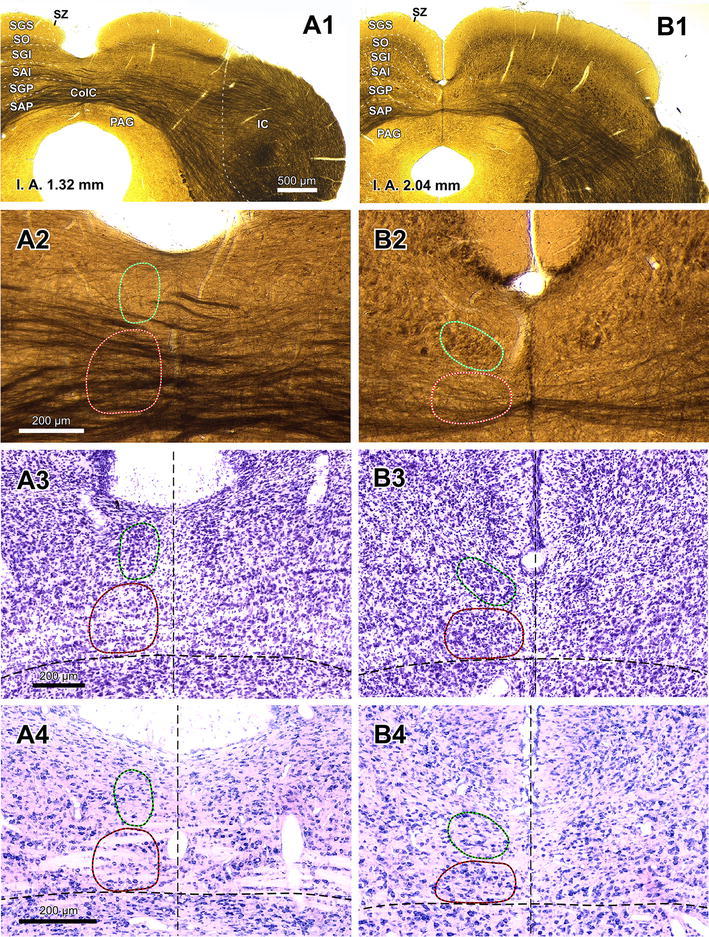
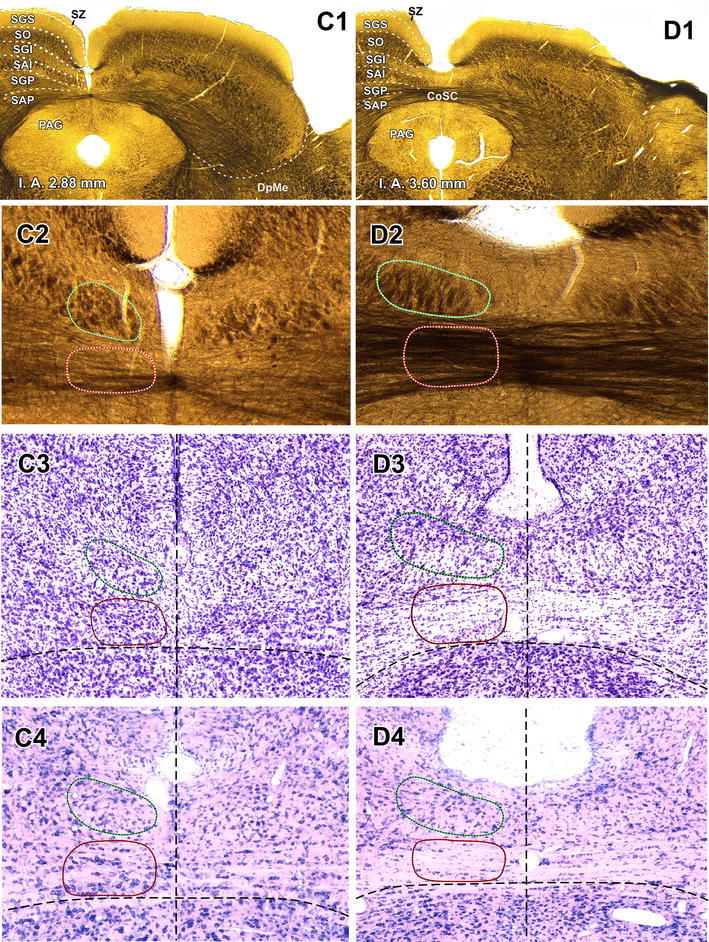
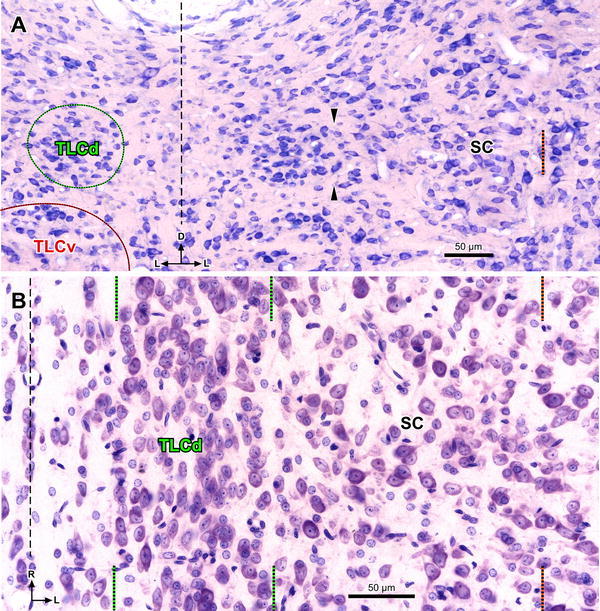
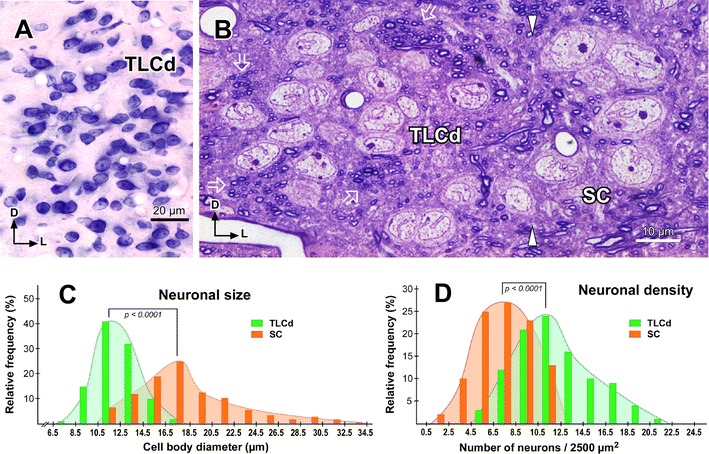
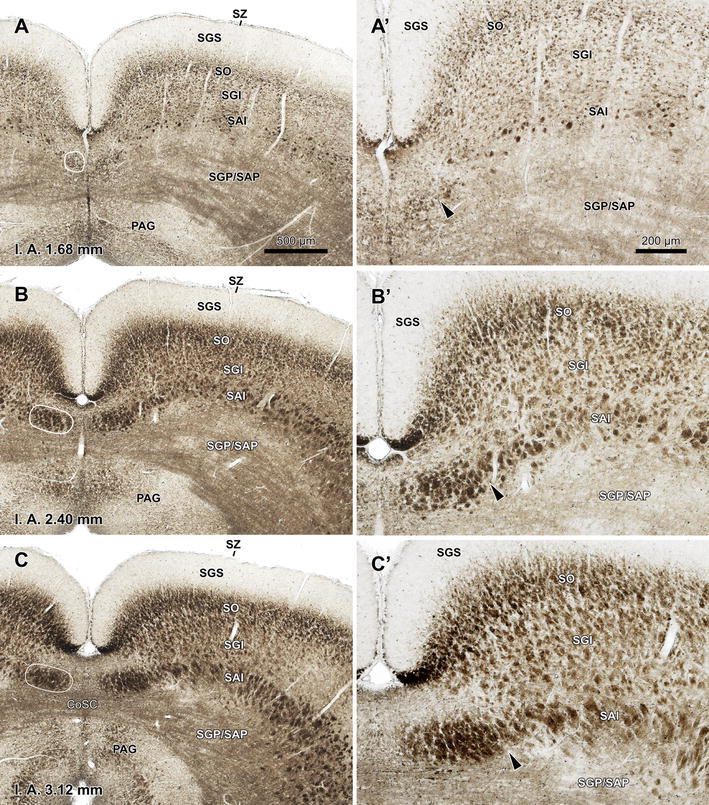
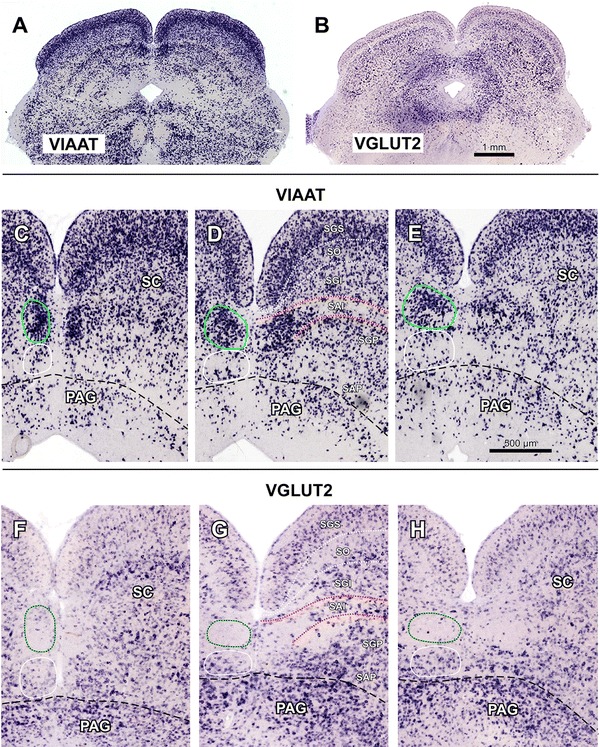
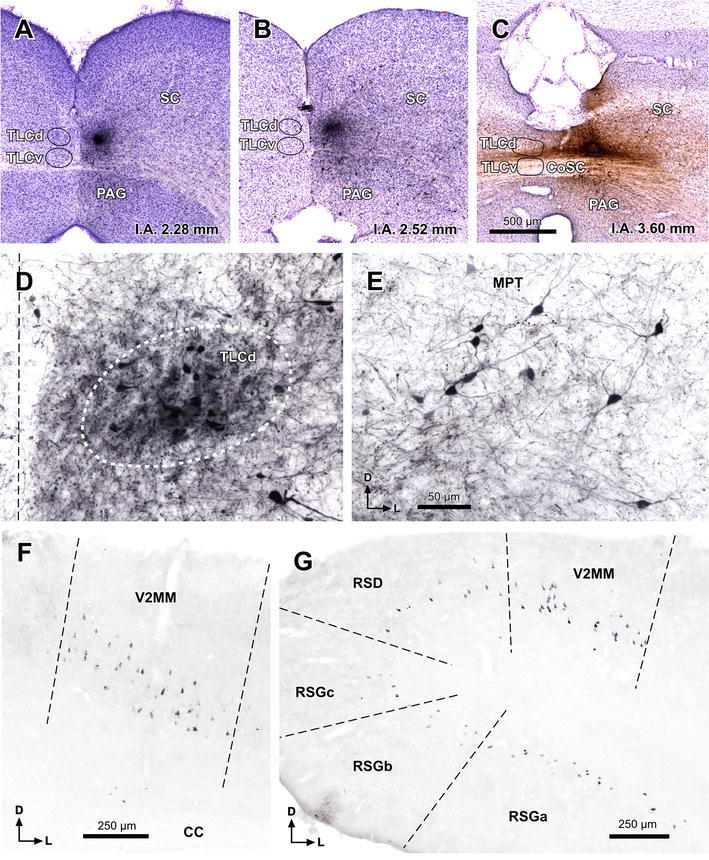
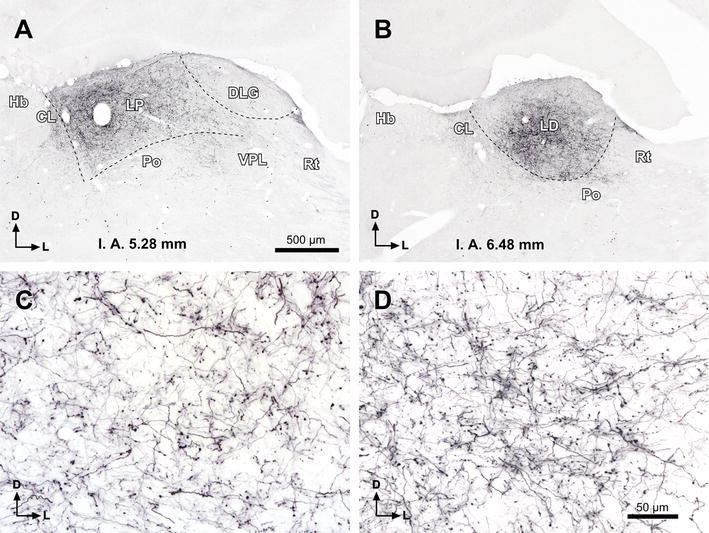
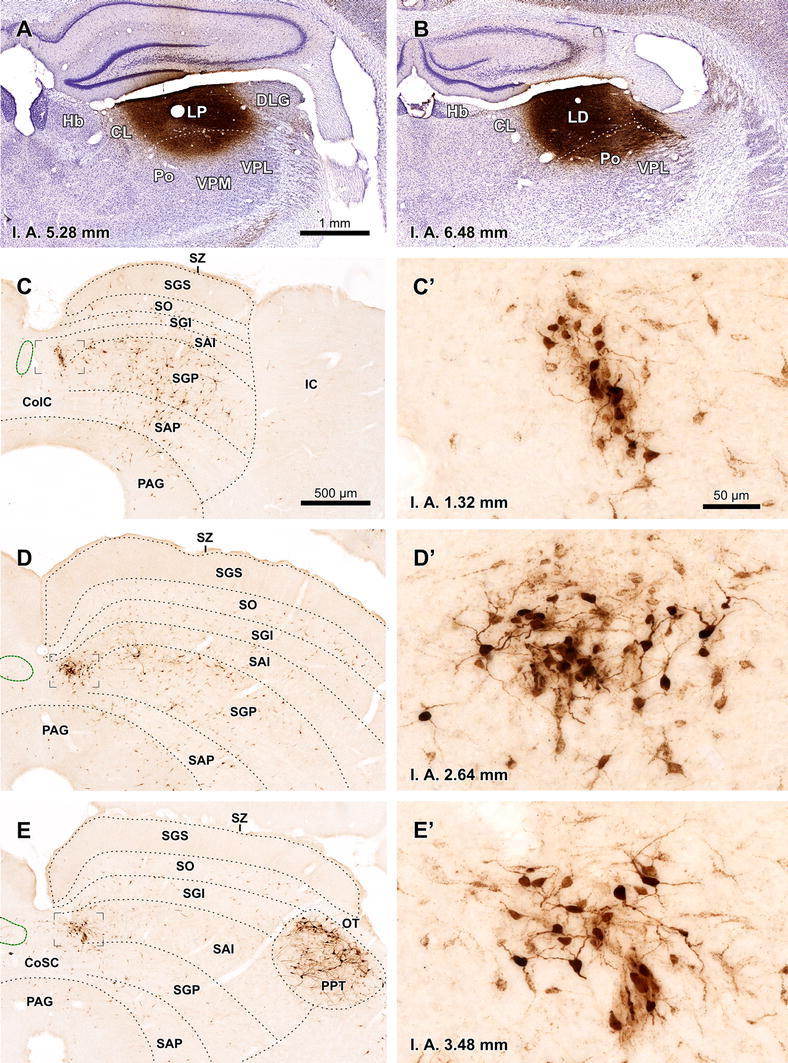
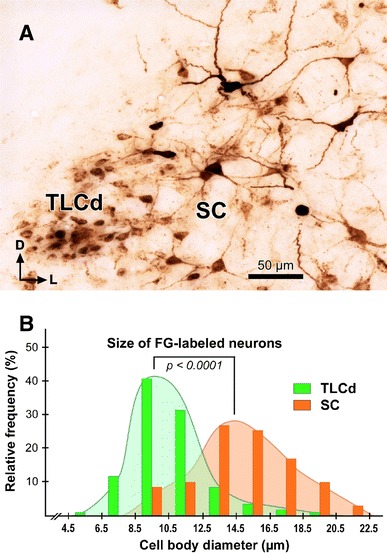
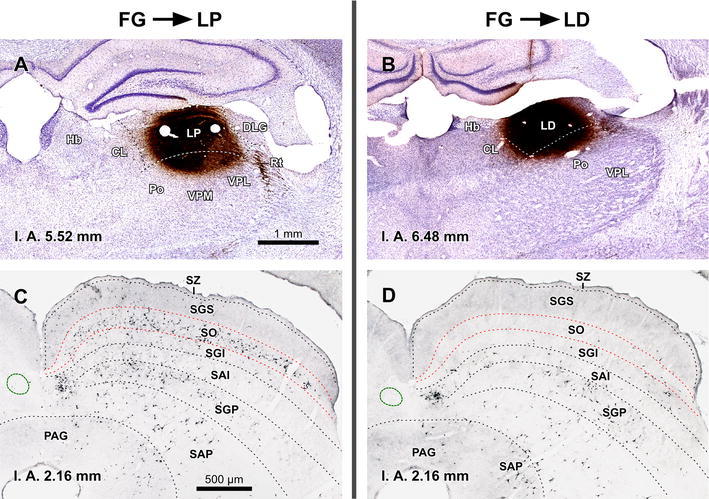
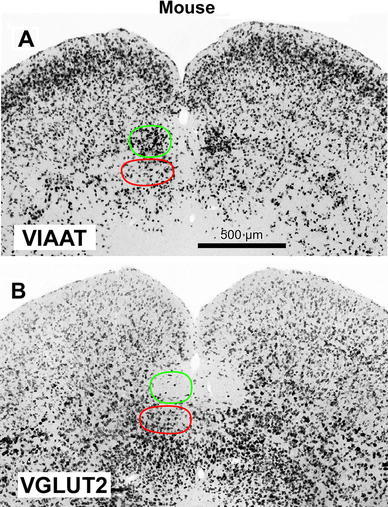
The tectal longitudinal column (TLC) is a longitudinally oriented, long and narrow nucleus that spans the paramedian region of the midbrain tectum of a large variety of mammals (Saldaña et al. in J Neurosci 27:13108-13116, 2007). Recent analysis of the organization of this region revealed another novel nucleus located immediately dorsal, and parallel, to the TLC. Because the name "tectal longitudinal column" also seems appropriate for this novel nucleus, we suggest the TLC described in 2007 be renamed the "ventral tectal longitudinal column (TLCv)", and the newly discovered nucleus termed the "dorsal tectal longitudinal column (TLCd)". This work represents the first characterization of the rat TLCd. A constellation of anatomical techniques was used to demonstrate that the TLCd differs from its surrounding structures (TLCv and superior colliculus) cytoarchitecturally, myeloarchitecturally, neurochemically and hodologically. The distinct expression of vesicular amino acid transporters suggests that TLCd neurons are GABAergic. The TLCd receives major projections from various areas of the cerebral cortex (secondary visual mediomedial area, and granular and dysgranular retrosplenial cortices) and from the medial pretectal nucleus. It densely innervates the ipsilateral lateral posterior and laterodorsal nuclei of the thalamus. Thus, the TLCd is connected with vision-related neural centers. The TLCd may be unique as it constitutes the only known nucleus made of GABAergic neurons dedicated to providing massive inhibition to higher order thalamic nuclei of a specific sensory modality.


Figures

Fig. 1
Fig. 1
Position and anatomical relationships of the TLCd. a Low magnification micrograph of a 60-μm thick coronal section of the rat midbrain tectum postfixed with osmium tetroxide to stain myelinated fibers black. Note the clear stratification of the SC. On the left side, the TLCd and TLCv have been outlined in green and red, respectively. The TLCd occupies the medialmost portion of the classical intermediate white layer of the SC (SAI), defined by the conspicuous bundles of cross-cut longitudinally oriented fibers. b Micrograph of a fresh, unstained and uncleared parasagittal section of the rat midbrain tectum through the TLCd and TLCv. In this material, cross-cut fiber fascicles appear dark and stand out over a clear background, thus highlighting the tectal commissures. c Schematic drawing of the section depicted in b. The blue line outlines the continuous fiber fascicle formed by the CoIC and the CoSC. The TLCv has been represented in light red, and the TLCd in green. The lines that span the TLC and fan out in its rostral pole represent the fascicle of the TLCd (see text). Three-dimensional reconstructions of the rat midbrain, seen from the left side of the brain (d) or from a point located above and slightly rostral (e). The TLCd and the TLCv have been represented in green and red, respectively. For abbreviations, see list
Fig. 2
Fig. 2
The TLCd in coronal sections. Micrographs of coronal sections through various rostrocaudal levels of the rat TLCd. All four micrographs in any given column correspond to the same rostrocaudal level, whose distance with respect to the coronal interaural plane (IA) is indicated in the upper panel. In each column, the first panel (a1 through d1) shows a low magnification micrograph of a 60-μm thick coronal section postfixed with osmium tetroxide. The second picture (a2 through d2) shows at higher magnification the paramedian region of the section depicted above. The third micrograph (a3 through d3) illustrates a 40-μm thick, frozen section stained with the Nissl method, and the fourth micrograph (a4 through d4) shows a 15-μm thick, paraffin-embedded section stained with the Giemsa method. The left TLCd has been outlined in green, and the left TLCv in red. The vertical dashed lines indicate the midline. The calibration bar in the first micrograph of each row applies to all micrographs in the same row. Calibration bars uncorrected for shrinkage. For abbreviations, see list
Fig. 2
Fig. 2
The TLCd in coronal sections. Micrographs of coronal sections through various rostrocaudal levels of the rat TLCd. All four micrographs in any given column correspond to the same rostrocaudal level, whose distance with respect to the coronal interaural plane (IA) is indicated in the upper panel. In each column, the first panel (a1 through d1) shows a low magnification micrograph of a 60-μm thick coronal section postfixed with osmium tetroxide. The second picture (a2 through d2) shows at higher magnification the paramedian region of the section depicted above. The third micrograph (a3 through d3) illustrates a 40-μm thick, frozen section stained with the Nissl method, and the fourth micrograph (a4 through d4) shows a 15-μm thick, paraffin-embedded section stained with the Giemsa method. The left TLCd has been outlined in green, and the left TLCv in red. The vertical dashed lines indicate the midline. The calibration bar in the first micrograph of each row applies to all micrographs in the same row. Calibration bars uncorrected for shrinkage. For abbreviations, see list
Fig. 3
Fig. 3
Basic cytoarchitecture of the rat TLCd. a Micrograph of a 15-μm thick, paraffin-embedded coronal section stained with the Giemsa method. On the left side the TLCd has been outlined in green, and the TLCv in red. The black arrowheads indicate the border between the TLCd and the SC. Note the smaller average size and higher homogeneity and cell packing density of TLCd neurons versus TLCv or SC neurons. The vertical dashed black line indicates the midline. b Micrograph of a 15-μm thick, paraffin-embedded horizontal section through the TLCd and the medial portion of the SC stained with the Nissl method. The vertical dashed black line indicates the midline. In this plane of section, the TLCd, delimited by the green lines, stands out as a column of small, rostrocaudally oriented and densely packed neurons, which clearly contrast with the much more polymorphic and loosely arranged neurons of the SC. The orange lines of both panels indicate the lateral border of the 200 μm wide area of the SC immediately adjacent to the TLCd, where the samples for the quantitative analysis of neuronal size and packing density were taken from. Calibration bars uncorrected for shrinkage
Fig. 4
Fig. 4
Basic cytoarchitecture and morphometry of the rat TLCd. a Detail of the TLCd in a 15-μm thick, paraffin-embedded coronal section stained with the Giemsa method. Note the remarkable homogeneity and predominantly horizontal orientation of the cell bodies. b High magnification, digital micrograph of a toluidine blue-stained semithin coronal section through the area of transition between the TLCd and the SC. The border between the two nuclei is indicated by the white arrowheads. Note the conspicuous difference between TLCd neurons and the much larger, adjacent SC neurons. The white open arrows indicate ill-defined bundles of predominantly thin myelinated axons of the fascicle of the TLCd. Calibration bars uncorrected for shrinkage. c Histogram of the maximum diameter of the cell body of neurons in the TLCd (green mean = 12.24 μm ± 1.78 SD; n = 122) and the adjacent SC (orange mean = 18.29 ± 4.52 SD, n = 185) measured from semithin coronal sections similar to the one depicted in b. Measured SC neurons were limited to those located within 200 μm of the lateral border of the TLCd. Note that there is very little overlap between the two populations. SC neurons are generally larger and more heterogeneous than TLCd neurons. d Histogram of the neuronal packing density of the TLCd (green mean = 7.43 ± 3.73 SD; n = 100 square areas) and the adjacent SC (orange 7.43 ± 2.49 SD; n = 100 square areas). Density is expressed as the number of neurons present in square areas of 2500 μm2 of 15 μm thick, coronal paraffin-embedded sections stained by the Giemsa method, similar to the one depicted in Fig. 3a. Sample areas from the SC were limited to those located within 200 μm of the lateral border of the TLCd
Fig. 5
Fig. 5
Basic myeloarchitecture of the rat TLCd. ac Micrographs of fresh unstained and uncleared coronal sections through three rostrocaudal levels of the midbrain tectum. Each micrograph is paired on the right with a higher magnification of the TLC and the adjacent SAI (a′–c′). Cross-cut axons appear dark, thus delineating the TLCd, the SAI and the optic layer of the SC (SO). The fascicle of the TLCd has been outlined in white on the left side. The black arrowheads indicate the limit between the fascicle of the TLCd and the SAI. At caudal levels (a, a′), the TLCd contains individual axons that are clearly discernable from the bundles of cross-cut fibers of the SAI. At central (b, b′) and rostral levels (c, c′) the fascicle of the TLCd appears as a distinct darker structure made of cross-cut fiber bundles that are on average thinner and more tightly packed than those of the SAI. The interaural (IA) coordinate of each plane is indicated at the bottom of the micrographs. Calibration bar in a applies also to b, c. Calibration bar in a′ applies also to b′, c′. For abbreviations, see list
Fig. 6
Fig. 6
Rat TLCd neurons express the mRNA for VIAAT, but not for VGLUT2. Micrographs of coronal sections of the rat midbrain tectum processed by in situ hybridization to visualize the expression of VIAAT (a, ce) or VGLUT2 (b, fh). a and b show panoramic views of sections through the central rostrocaudal third of the TLCd. ch show details of sections through the caudal (c, f), central (d, g) and rostral (e, h) portions of the TLCd. On the left side, the TLCd has been outlined in green. Note the complementary pattern of staining in the TLCd with the two markers. The horizontal band in the center of the SC with a higher concentration of neurons labeled for the VIAAT, visible in a, ce, corresponds to the upper portion of the deep gray layer (SGP); the SAI stands out due to the paucity of labeled neurons, which strongly contrasts with the abundance of somata in the TLCd. Calibration bar in b applies also to a. Calibration bar in e applies also to remaining panels. Calibration bars uncorrected for shrinkage
Fig. 7
Fig. 7
Main sources of input to the rat TLCd. a–c Micrographs of coronal sections through the center of single injection sites of BDA in the central (a, case 01101; b case 02088) or the rostral (c case 00268) rostrocaudal third of the TLCd. d Numerous TLCd neurons are retrogradely labeled in a section located 1,280 μm more caudal than the injection site depicted in c. e Retrogradely labeled neurons in the ipsilateral MPT (case 00268). f Retrogradely labeled neurons in a section through the rostral region of the ipsilateral V2MM (case 02088). g Retrogradely labeled neurons in a caudal section through the ipsilateral V2MM and retrosplenial cortices (case 02088). Calibration bar in c applies also to a and b. Calibration bar in e applies also to d. For abbreviations, see list
Fig. 8
Fig. 8
The TLCd sends dense projections to the ipsilateral lateral complex of the thalamus. Micrographs of coronal sections showing dense terminal fields of fibers labeled in the LP (a) and LD (b) following a single injection of BDA into the ipsilateral TLCd (case 00268; see injection site in Fig. 7c). c, d Details of the terminal fields of TLCd fibers from the sections depicted in a and b, respectively. Calibration bar in a applies also to b. Calibration bar in d applies also to c. Calibration bars uncorrected for shrinkage. For abbreviations, see list
Fig. 9
Fig. 9
TLCd neurons are retrogradely labeled following injections of FluoroGold into the ipsilateral lateral complex of the thalamus. a, b Micrographs of Nissl-counterstained coronal sections through the center of the injection sites of FluoroGold into LP (a) and LD (b). Case 05239. ce Micrographs of coronal sections through various rostrocaudal levels of the midbrain tectum of the same case. At each level, the TLCd stands out as a darkly stained spot whose density of labeled neurons surpasses that of any region of the SC. c′–e′ Details of the TLCd in the same sections shown in the left column. The interaural (IA) coordinate of each plane is indicated at the bottom of the micrographs. Calibration bar in a applies also to b. Calibration bar in c applies also to d, e. Calibration bar in c′ applies also to d′, e′. Calibration bars uncorrected for shrinkage. For abbreviations, see list
Fig. 10
Fig. 10
Comparison between TLCd and SC neurons that innervate the lateral complex of the thalamus. a High magnification micrograph of a section through the central rostrocaudal third of the TLCd from a case similar to the one depicted in Fig. 9. Case 05240. Labeled TLCd neurons (left half of the micrograph) are small, tightly packed, posses homogeneous round or oval cell bodies, and display a punctate reaction product limited to the cell body and, in some instances, the most proximal portions of their dendritic trees. In contrast, labeled SC neurons possess much larger, polygonal cell bodies and display an impressive filling of their dendritic trees. Calibration bar uncorrected for shrinkage. b Histogram of the maximum diameter of the cell body of neurons labeled in the TLCd (green mean = 10.64 μm ± 2.24 SD; n = 120) and the adjacent SC (orange mean = 14.90 μm ± 2.98 SD; n = 71) measured from the case depicted in Fig. 9. Measured SC neurons were limited to those located within 500 μm of the lateral border of the TLCd. Note that the labeled SC neurons are on average much larger and more heterogeneous than the labeled TLCd neurons
Fig. 11
Fig. 11
TLCd neurons innervate both LP and LD. a, b Micrographs of Nissl-counterstained coronal sections through the center of a single injection site of FluoroGold into LP (a case 05222) or LD (b case 05209). cd Micrographs of coronal sections through the ipsilateral half of the midbrain tectum of the same cases. c Following injection into LP, numerous neurons are labeled in the optic layer (SO), with fewer neurons labeled in deep layers, and even fewer in the intermediate layers. The neurons labeled in the superficial gray layer (SGS) are the consequence of the spread of the tracer into the most medial portion of the dorsal lateral geniculate nucleus (DLG). d Following injection into LD, labeled neurons are scattered throughout the deep layers of the SC and, to a lesser extent, in the intermediate layers, whereas the superficial layers are devoid of labeled neurons. In both types of cases, the concentration of neurons labeled in the TLCd surpasses that of any other territory of the tectum. The interaural (IA) coordinate of each plane is indicated at the bottom of the micrographs. Calibration bar in a applies also to b. Calibration bar in c applies also to d. Calibration bars uncorrected for shrinkage. For abbreviations, see list
Fig. 12
Fig. 12
Mouse TLCd neurons express the mRNA for VIAAT, but not for VGLUT2. Micrographs of coronal sections of the mouse midbrain tectum processed by in situ hybridization to visualize the expression of the mRNA for VIAAT (a) or the mRNA for VGLUT2 (b). Like in the rat (Fig. 6), the mouse TLCd stands out due to the very high density of neurons that express the VIAAT and the paucity of neurons that express the VGLUT2. Calibration bar in a applies also to b. Calibration bar uncorrected for shrinkage
Fig. 13
Fig. 13
Schematic diagram of the main neural connections of the rat TLCd. The afferent and efferent connections of the TLCd unraveled in this study have been indicated by green arrows. The thickness of the different arrows roughly corresponds to the density of the projections. Note that the TLCd sends a dense inhibitory projection to LP and LD

References

    1. Aparicio MA, Viñuela A, Saldaña E. Projections from the inferior colliculus to the tectal longitudinal column in the rat. Neuroscience. 2010;166:653–664. doi: 10.1016/j.neuroscience.2009.12.074. - DOI - PubMed
    1. Arcelli P, Frassoni C, Regondi MC, De Biasi S, Spreafico R. GABAergic neurons in mammalian thalamus: a marker of thalamic complexity? Brain Res Bull. 1997;42:27–37. doi: 10.1016/S0361-9230(96)00107-4. - DOI - PubMed
    1. Bajo VM, Nodal FR, Bizley JK, King AJ. The non-lemniscal auditory cortex in ferrets: convergence of corticotectal inputs in the superior colliculus. Front Neuroanat. 2010;4:18. - PMC - PubMed
    1. Baldauf ZB, Wang S, Chomsung RD, May PJ, Bickford ME. Ultrastructural analysis of projections to the pulvinar nucleus of the cat. II: Pretectum. J Comp Neurol. 2005;485:108–126. doi: 10.1002/cne.20487. - DOI - PMC - PubMed
    1. Barthó P, Freund TF, Acsády L. Selective GABAergic innervation of thalamic nuclei from zona incerta. Eur J Neurosci. 2002;16:999–1014. doi: 10.1046/j.1460-9568.2002.02157.x. - DOI - PubMed

Publication types

MeSH terms

Substances

LinkOut - more resources