Review
. 2013 Jun;40(3):343-58.
doi: 10.1007/s10928-013-9306-4. Epub 2013 Mar 7.

Cerebral microdialysis in clinical studies of drugs: pharmacokinetic applications

Affiliations
Review

Cerebral microdialysis in clinical studies of drugs: pharmacokinetic applications

Richard J Shannon et al. J Pharmacokinet Pharmacodyn. 2013 Jun.

Abstract

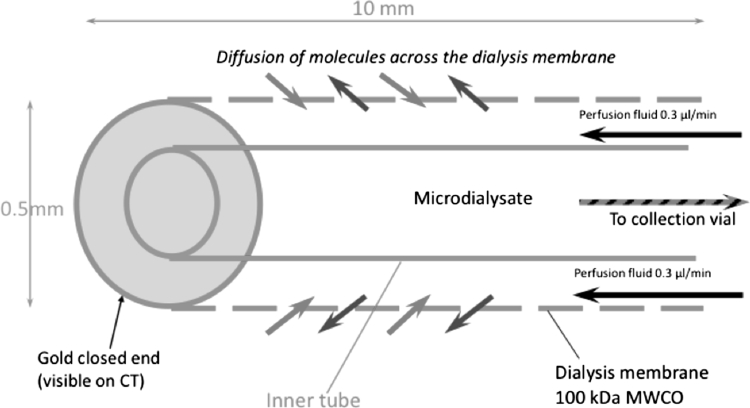
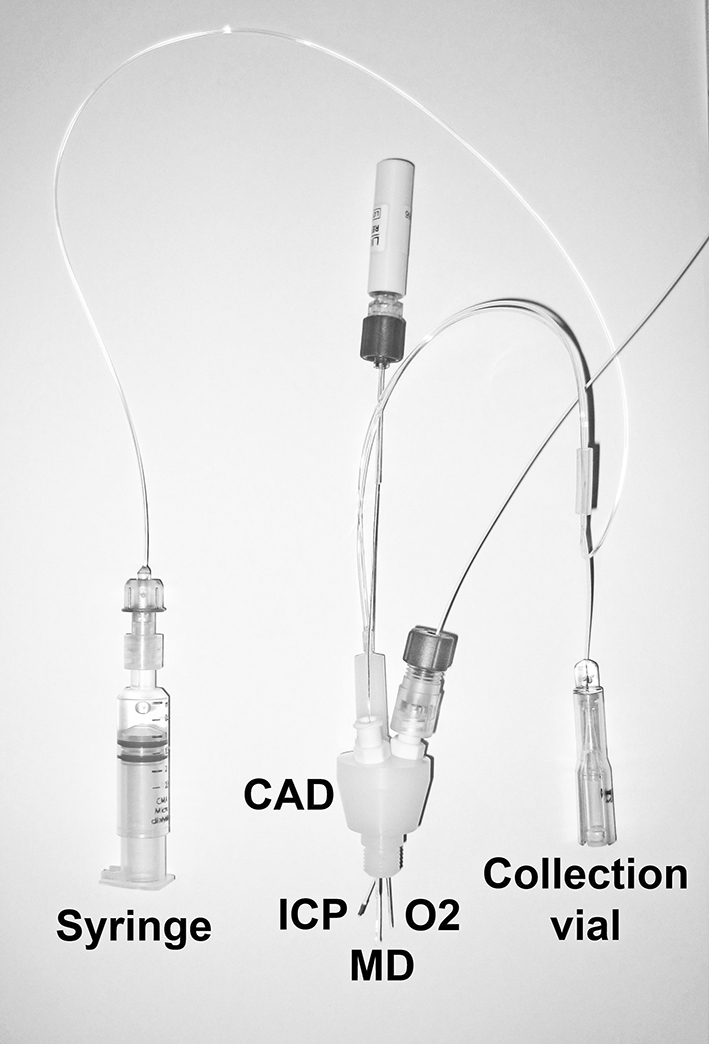
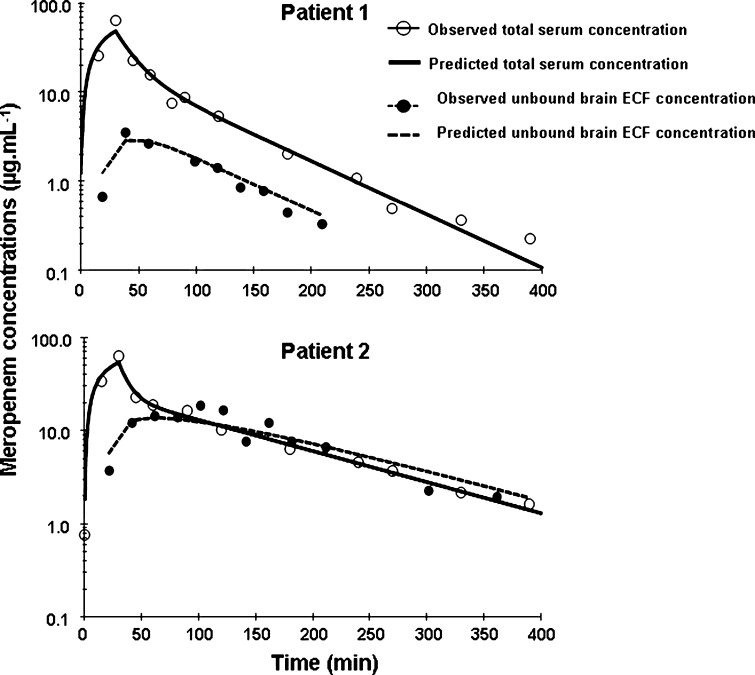
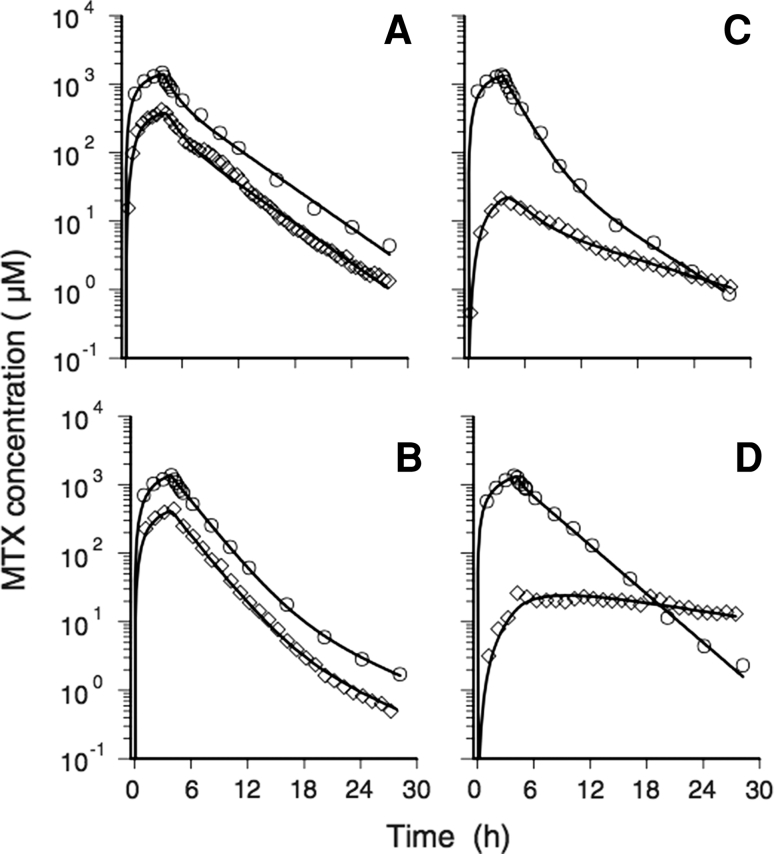
The ability to deliver drug molecules effectively across the blood-brain barrier into the brain is important in the development of central nervous system (CNS) therapies. Cerebral microdialysis is the only existing technique for sampling molecules from the brain extracellular fluid (ECF; also termed interstitial fluid), the compartment to which the astrocytes and neurones are directly exposed. Plasma levels of drugs are often poor predictors of CNS activity. While cerebrospinal fluid (CSF) levels of drugs are often used as evidence of delivery of drug to brain, the CSF is a different compartment to the ECF. The continuous nature of microdialysis sampling of the ECF is ideal for pharmacokinetic (PK) studies, and can give valuable PK information of variations with time in drug concentrations of brain ECF versus plasma. The microdialysis technique needs careful calibration for relative recovery (extraction efficiency) of the drug if absolute quantification is required. Besides the drug, other molecules can be analysed in the microdialysates for information on downstream targets and/or energy metabolism in the brain. Cerebral microdialysis is an invasive technique, so is only useable in patients requiring neurocritical care, neurosurgery or brain biopsy. Application of results to wider patient populations, and to those with different pathologies or degrees of pathology, obviously demands caution. Nevertheless, microdialysis data can provide valuable guidelines for designing CNS therapies, and play an important role in small phase II clinical trials. In this review, we focus on the role of cerebral microdialysis in recent clinical studies of antimicrobial agents, drugs for tumour therapy, neuroprotective agents and anticonvulsants.


Figures

Fig. 1
Fig. 1
Extracellular fluid is the key compartment for the action of a neuroactive compound. The diagram is adapted from Alavijeh et al. [7] and Shen et al. [8]. BBB is Blood–brain barrier. BCSFB is blood–cerebrospinal fluid barrier. BCSFB influx and efflux is via the choroid plexus, which is also the major source of CSF. A Bulk flow of ECF to CSF with no barrier. B CSF fluid (and solutes) are absorbed into venous blood via the arachnoid villi. C Uptake of drug into cells is either passive or transporter driven, similarly for efflux from cells. Biological effect is usually due to interaction of drug with a membrane receptor or an intracellular target
Fig. 2
Fig. 2
Schematic of the microdialysis catheter tip. Substances in the extracellular fluid outside the catheter tip are able to diffuse across the microdialysis membrane to be collected for analysis
Fig. 3
Fig. 3
A triple lumen cranial access device (CAD) is inserted into the skull, to provide access into the brain for the microdialysis catheter (MD) and for sensors measuring intracranial pressure (ICP) and brain tissue oxygen concentration (O2). A pump (not shown) drives the syringe that delivers perfusion fluid into the microdialysis catheter, and the microdialysate emerges from the brain into a collection vial. The vial is changed hourly by a nurse and analysed at the bedside on a clinical microdialysis analyser (ISCUS or CMA600, for glucose, lactate, pyruvate, glutamate and glycerol) and in the laboratory for other analytes (e.g. drugs) as desired. Image copyright K.L.H. Carpenter and reproduced here with her permission
Fig. 4
Fig. 4
Pharmacokinetics of meropenem in serum and brain ECF, from a study by Dahyot-Fizelier et al. [18]. Individual concentrations of meropenem in serum (white circle), and in brain extracellular fluid (ECF) measured using microdialysis (black circle), plotted versus time in two critical-care patients (acute brain injury) after a 30-min intravenous infusion of 1 g of meropenem administered every 8 h during a multiple-dosing regimen. The solid line represents the predicted concentrations in serum, and the dashed line represents the predicted concentrations in brain. Copyright: American Society for Microbiology [Antimicrobial Agents and Chemotherapy, 54: 3502–3504, doi:10.1128/AAC.01725-09] and reproduced with permission
Fig. 5
Fig. 5
Pharmacokinetics of methotrexate, from a study by Blakeley et al. [40]. Time courses of the MTX concentration in plasma (white circle) and brain ECF (white diamonds). The plasma profiles are similar in each of the four patients, with peak drug levels ranging from 1,321 to 1,407-μM at the end of the 4-h i.v. infusion of MTX 12 g/m2. Time courses of MTX in ECF are dependent upon whether the probe of the microdialysis catheter was placed in contrast enhancing (patients a and b) or non-enhancing (patients c and d) regions of the tumor.” Reproduced with kind permission from Springer Science+Business Media: Journal of Neuro-oncology, Effect of blood–brain barrier permeability in recurrent high grade gliomas on the intratumoral pharmacokinetics of methotrexate: a microdialysis study, vol. 91, 2012, pp. 51–58. Blakeley JO, Olson J, Grossman SA, He X, Weingart J, Supko JG, Fig. 2
Fig. 6
Fig. 6
Levels of vigabatrin (VGB) and GABA in TBI patients versus time, adapted from Carpenter et al. [50]. VGB was administered enterally (0.5 g twice daily). a Concentrations (mean ± SD) of VGB (μmol/L) in blood plasma for the first half-day following the first VGB dose, for five patients. b Concentrations of VGB (μmol/L) (indicated by black diamonds) and GABA (μmol/L) (grey triangles) versus time in brain microdialysates from patient W (male, 17 years, admission GCS 3). Day 0 is the day of injury. Microdialysis started on day 3 post-injury, and VGB treatment commenced on day 4 (18:00). Data are for the first 1.5 days of VGB administration. The times of VGB doses are indicated by grey squares. c Concentrations of VGB (μmol/L) and GABA (μmol/L) in brain microdialysates from patient R (male, 33 years, admission GCS 14) versus time, for the first 2.5 days of VBG administration. Microdialysis commenced on day 1 post-injury, and VGB treatment commenced on day 6 (23:05). Symbols are as in panel (b). d Concentrations of VGB (μmol/L) and GABA (μmol/L) versus time in brain microdialysates from patient C (male, 66 years, admission GCS 7) for the first 8.5 days of VGB administration. Symbols are as in panel (b). Microdialysis commenced on day 2 post-injury, and VGB treatment commenced on day 3 (22:00). There was a gap of 36 h between the sixth and seventh doses

References

    1. Kaitin KI, Milne CP. A dearth of new meds. Sci Am. 2011;305:16. doi: 10.1038/scientificamerican0811-16. - DOI - PubMed
    1. Helmy A, Carpenter KL, Hutchinson PJ. Microdialysis in the human brain and its potential role in the development and clinical assessment of drugs. Curr Med Chem. 2007;14:1525–1537. doi: 10.2174/092986707780831113. - DOI - PubMed
    1. Alavijeh MS, Palmer AM. Measurement of the pharmacokinetics and pharmacodynamics of neuroactive compounds. Neurobiol Dis. 2010;37:38–47. doi: 10.1016/j.nbd.2009.09.025. - DOI - PubMed
    1. de la Pena A, Liu P, Derendorf H. Microdialysis in peripheral tissues. Adv Drug Deliv Rev. 2000;45:189–216. doi: 10.1016/S0169-409X(00)00106-X. - DOI - PubMed
    1. Pardridge WM. The blood–brain barrier and neurotherapeutics. NeuroRx. 2005;2:1–2. doi: 10.1602/neurorx.2.1.1. - DOI - PMC - PubMed

Publication types

MeSH terms

Substances