. 2013 May;87(10):5554-63.
doi: 10.1128/JVI.03134-12. Epub 2013 Mar 6.

Adeno-associated virus-mediated gene transfer leads to persistent hepatitis B virus replication in mice expressing HLA-A2 and HLA-DR1 molecules

Affiliations

Adeno-associated virus-mediated gene transfer leads to persistent hepatitis B virus replication in mice expressing HLA-A2 and HLA-DR1 molecules

Sarah Dion et al. J Virol. 2013 May.

Abstract

Hepatitis B virus (HBV) persistence may be due to impaired HBV-specific immune responses being unable to eliminate efficiently or cure infected hepatocytes. The immune mechanisms that lead to HBV persistence have not been completely identified, and no appropriate animal model is available for such studies. Therefore, we established a chronic HBV infection model in a mouse strain with human leukocyte antigen A2/DR1 (HLA-A2/DR1) transgenes and an H-2 class I/class II knockout. The liver of these mice was transduced with adeno-associated virus serotype 2/8 (AAV2/8) carrying a replication-competent HBV DNA genome. In all AAV2/8-transduced mice, hepatitis B virus surface antigen, hepatitis B virus e antigen, and HBV DNA persisted in serum for at least 1 year. Viral replication intermediates and transcripts were detected in the livers of the AAV-injected mice. The hepatitis B core antigen was expressed in 60% of hepatocytes. No significant inflammation was observed in the liver. This was linked to a higher number of regulatory T cells in liver than in controls and a defect in HBV-specific functional T-cell responses. Despite the substantial tolerance resulting from expression of HBV antigens in hepatocytes, we succeeded in priming functional HBV-specific T-cell responses in peripheral tissues, which subsequently reached the liver. This AAV2/8-HBV-transduced HLA-A2/DR1 murine model recapitulates virological and immunological characteristics of chronic HBV infection, and it could be useful for the development of new treatments and immune-based therapies or therapeutic vaccines for chronic HBV infections.


Figures

Fig 1
Fig 1
Persistence of HBV antigens and HBV DNA in sera of AAV2/8-HBV-injected mice. A total of 5 × 10¹⁰ vg of AAV2/8-HBV was administered into female or male HLA-A2/DR1 mice by injection into the tail vein. (A) HBsAg in sera was assayed at the indicated time points, and the results are expressed as μg/ml. (Inset) Kinetics of HBsAg levels in sera of male and female mice during the first 16 weeks post-AAV2/8-HBV injection. (B) Serum HBeAg levels are expressed as an S/CO ratio. The values reported are means ± SEM. (C) HBV DNA titers, expressed as copies/ml, were determined at the indicated times postinjection in sera from individual female or male mice. Results are representative of three independent experiments.
Fig 2
Fig 2
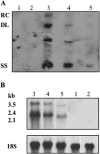
HBV replication and expression in the liver of AAV2/8-HBV-injected mice. Liver tissues were collected from HLA-A2/DR1 mice after PBS (lane 1) or AAV2/8-empty (lane 2) injection or 6 weeks, 12 weeks, and 1 year after AAV2/8-HBV injection (lanes 3, 4, and 5, respectively). (A) Intermediates of HBV DNA replication were detected by Southern blotting. The relaxed-circular (RC), double-stranded linear (DL), and single-stranded (SS) DNAs were revealed. (B) Northern blotting to detect 3.5-kb pregenomic and 2.4- and 2.1-kb envelope mRNAs.
Fig 3
Fig 3
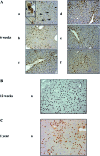
Expression of HBcAg in the liver of AAV2/8-HBV-injected mice. Shown is immunohistochemical staining for HBcAg in liver sections from mice injected with 5 × 10¹⁰ vg of AAV2/8-HBV at week 6 (A), week 12 (B), or 1 year (C) postinjection. Different parts of the liver were analyzed: left lateral lobe (a), left medial lobe (b), right medial lobe (c), right lateral lobe (d), caudate lobe (e), and papillary process (f). Nuclear and cytoplasmic localizations of HBcAg are indicated by black and white arrows, respectively, on an enlarged magnification in panel Aa. Original magnification, ×250. Results for one representative mouse are shown.
Fig 4
Fig 4
Histological analysis of liver sections and transaminase activities in sera from AAV2/8-HBV-injected mice. (A) Hematoxylin and eosin staining of one representative lobe of liver sections from mice 6 weeks or 1 year after injection of 5 × 10¹⁰ vg of AAV2/8-HBV or PBS. Original magnification, ×250. Results are for one representative mouse of five. (B and C) Mean ASAT (B) and ALAT (C) activities in sera from 10 AAV2/8-HBV-injected, 10 AAV2/8-empty-injected, and 4 PBS-injected mice, expressed as U/liter.
Fig 5
Fig 5
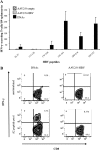
HBV-specific T-cell responses of AAV2/8-HBV-injected mice. IFN-γ-secreting T cells detected by ELISPOT assay of splenocytes (A) and intracellular cytokine staining for IFN-γ of intrahepatic lymphocytes (B) were obtained from 5 to 10 HLA-A2/DR1 mice injected 6 weeks previously with AAV2/8-HBV or AAV2/8-empty or immunized 2 weeks previously with HBc- and HBs-expressing DNA vectors as positive controls. (A) HLA-A2- and HLA-DR1-restricted peptides derived from either HBcAg (18-27) or HBsAg (111-125, 179-194, 183-191, 200-214, and 348-357) were used to stimulate splenocytes ex vivo. (B) Intrahepatic lymphocytes were analyzed after incubation with a pool of HLA-A2-restricted peptides (183-191, 204-212, and 348-357) or in medium alone (unstimulated). Representative fluorescence-activated cell sorter plots for IFN-γ-secreting T cells in the liver of DNA- or AAV2/8-HBV-injected mice are shown. Values in the upper right square of each panel represent the percentage of CD8+ T cells that are also IFN-γ-positive cells. Results are representative of three independent experiments.
Fig 6
Fig 6
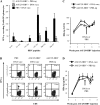
HBV-specific T-cell responses of HBV carrier mice immunized with HBc- and HBs-expressing DNA vectors. (A and B) ELISPOT assays performed on splenocytes (A) and intracellular cytokine staining (B) of intrahepatic lymphocytes from 5 to 10 HLA-A2/DR1 mice immunized with HBc- and HBs-expressing DNA vectors and controls (PBS). Mice were previously injected either with AAV2/8-HBV or with PBS 32 days earlier. (A) Peptides derived from HBcAg (18-27) and HBsAg (111-125, 179-194, 183-191, 200-214, and 348-357) were used to stimulate splenocytes ex vivo. (B) Intrahepatic lymphocytes were analyzed for CD8+ T cells producing intracellular IFN-γ after incubation with a pool of HLA-A2-restricted peptides (183-191, 204-212, and 348-357) or with medium alone (unstimulated). Representative fluorescence-activated cell sorter plots used to determine the percentages of IFN-γ-secreting T cells present in the liver of mice are shown. Values in the upper right squares are the percentages of CD8+ T cells that are IFN-γ-positive cells. (C and D) HBeAg (C) and HBsAg (D) titers in sera of mice that were first injected with AAV2/8-HBV and then immunized 32 days later (arrow) with DNA or received PBS. The values reported are means ± SEM, and results are representative of three independent experiments.
Fig 7
Fig 7
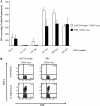
HBV-specific T-cell responses of mice immunized with HBc- and HBs-expressing DNA vectors. (A) ELISPOT assays performed on splenocytes from 8 HLA-A2/DR1 mice immunized with HBc- and HBs-expressing DNA vectors. Mice were previously (−32 days) injected either with AAV2/8-empty or with PBS. The peptides derived from HBcAg (18-27) and HBsAg (111-125, 179-194, 183-191, 200-214, and 348-357) were then used to stimulate splenocytes ex vivo. The values reported are means ± SEM. (B) Intrahepatic lymphocytes were analyzed for CD8+ T cells producing intracellular IFN-γ after incubation with a pool of HLA-A2-restricted peptides (183-191, 204-212, and 348-357) or with medium alone (unstimulated). Representative fluorescence-activated cell sorter plots used to determine the percentages of IFN-γ-secreting T cells present in the liver of mice are shown. Values in the upper right squares are the percentages of CD8+ T cells that are IFN-γ-positive cells.

References

    1. Ganem D, Prince AM. 2004. Hepatitis B virus infection—natural history and clinical consequences. N. Engl. J. Med. 350:1118–1129 - PubMed
    1. Rehermann B, Nascimbeni M. 2005. Immunology of hepatitis B virus and hepatitis C virus infection. Nat. Rev. Immunol. 5:215–229 - PubMed
    1. Maini MK, Schurich A. 2010. The molecular basis of the failed immune response in chronic HBV: therapeutic implications. J. Hepatol. 52:616–619 - PubMed
    1. Guidotti LG, Matzke B, Schaller H, Chisari FV. 1995. High-level hepatitis B virus replication in transgenic mice. J. Virol. 69:6158–6169 - PMC - PubMed
    1. Chisari FV. 1996. Hepatitis B virus transgenic mice: models of viral immunobiology and pathogenesis. Curr. Top. Microbiol. Immunol. 206:149–173 - PubMed

Publication types

MeSH terms