

Discriminating external and internal causes for heading changes in freely flying Drosophila
- PMID: 23468601
- PMCID: PMC3585425
- DOI: 10.1371/journal.pcbi.1002891
Discriminating external and internal causes for heading changes in freely flying Drosophila
Abstract
As animals move through the world in search of resources, they change course in reaction to both external sensory cues and internally-generated programs. Elucidating the functional logic of complex search algorithms is challenging because the observable actions of the animal cannot be unambiguously assigned to externally- or internally-triggered events. We present a technique that addresses this challenge by assessing quantitatively the contribution of external stimuli and internal processes. We apply this technique to the analysis of rapid turns ("saccades") of freely flying Drosophila melanogaster. We show that a single scalar feature computed from the visual stimulus experienced by the animal is sufficient to explain a majority (93%) of the turning decisions. We automatically estimate this scalar value from the observable trajectory, without any assumption regarding the sensory processing. A posteriori, we show that the estimated feature field is consistent with previous results measured in other experimental conditions. The remaining turning decisions, not explained by this feature of the visual input, may be attributed to a combination of deterministic processes based on unobservable internal states and purely stochastic behavior. We cannot distinguish these contributions using external observations alone, but we are able to provide a quantitative bound of their relative importance with respect to stimulus-triggered decisions. Our results suggest that comparatively few saccades in free-flying conditions are a result of an intrinsic spontaneous process, contrary to previous suggestions. We discuss how this technique could be generalized for use in other systems and employed as a tool for classifying effects into sensory, decision, and motor categories when used to analyze data from genetic behavioral screens.
Conflict of interest statement
The authors declare that no competing interests exist.
Figures
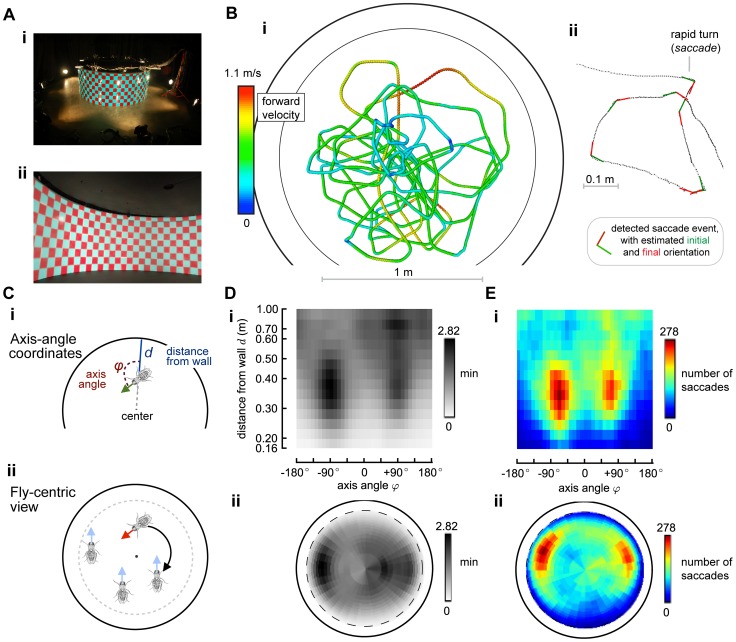
 , which is the time spent at each configuration
  . Panel E shows the number of saccades (both left and right) detected at each configuration.
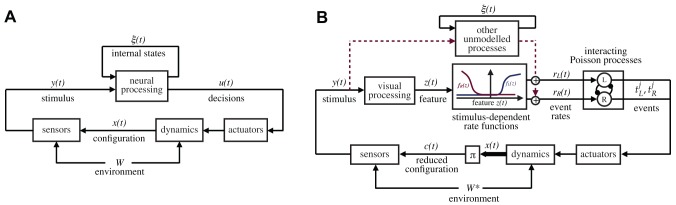
 is the animal configuration (position/velocity), which ultimately depends on the past history of the animal decisions, the body dynamics, and environmental effects, here abstractly represented by the variable
  . The stimulus
  perceived by the animal is a function of the animal configuration
  and the geometry/textures of the environment. In the most general terms, the actions of the animals,
  , are generated on the basis of the instantaneous stimulus
  as well as the internal state
  , which includes, for our purposes, everything which is not observable, including metabolic and neural states. Panel B illustrates the specialization of the model that we postulate. The decisions of the animals are represented by series of observable events belonging to a fixed set of classes; in our case these are left and right body saccades. The events are assumed to be generated by a set of interacting rate-variant Poisson processes. The instantaneous rates
  depend on several factors, including the unobservable states, and the external stimulus. The main hypothesis of this paper is that the contribution of the stimulus on the rate can be written as a function of a low-dimensional feature
  computed from the stimulus. The inference problem in this paper consists in identifying the functions
  that best explain the rates as a function of the stimulus (
 ). The diagram also shows the impact of other unmodeled neural processing based on internal states, acting as a disturbance in the model. We do not infer a functional description of this modeling, but we are able to bound its contribution and show that it is small with respect to the stimulus-induced contribution. The diagram also shows the reduced configuration
 , the subset of
  on which the stimulus actually depends. The reduced configuration depends on the particular experimental settings; in our case, we postulate that in a circular arena the stimulus is dependent on only two degrees of freedom. This is a hypothesis that can be verified a posteriori.
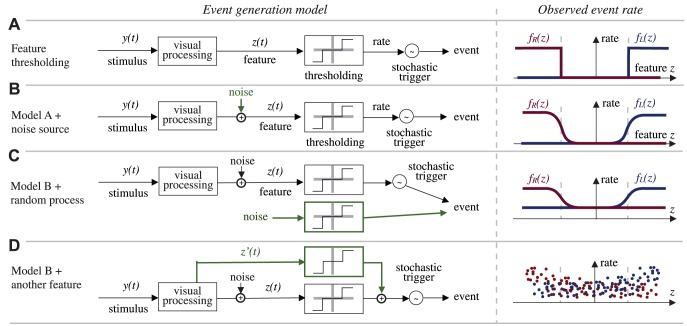
 is processed as to extract a one-dimensional feature
  on which the animal decisions are based. The models presented are meant to represent a sample of qualitatively different functional models of behavior generations, and not necessarily biologically plausible models of neural computation. Panel A-i shows a “hard threshold” model: if the feature
  is below a threshold, no event is generated, otherwise, the event is generated stochastically with a certain rate. Panel A-ii shows what would be the prediction of the model if we were to plot the saccade generation rate (an observable quantity) as a function of the feature
  , assuming we knew how to compute
  . Panel B shows the same model, but with noise affecting the computation of the feature. The effect on the observed rate would be to transform the hard threshold in a soft threshold. Panel C shows a model in which there is a parallel saccade generation mechanism, which generates saccades randomly independently of the stimulus. The effect of this on the measured rate is to raise uniformly the curves. Also the contribution of some internal processing based on internal neural states which were not a function of the instantantaneous stimulus would have the same effect on the rate statistics. Panel D shows the case where the behavior depends also on some other feature of the stimulus
  in addition to
  . In this case, if we plotted the rates as a function of
  , ignoring the dependency on
  , we would see that it is not possible for
  to explain the rates by itself. Therefore, once we have identified the curves
  ,
,  , and the feature
  , we are able to identify the contribution of a random generation process (or based on an internal state) as a uniform baseline saccade rate; and we can infer whether another feature is necessary to explain the behavior by the vertical spread of the rates.
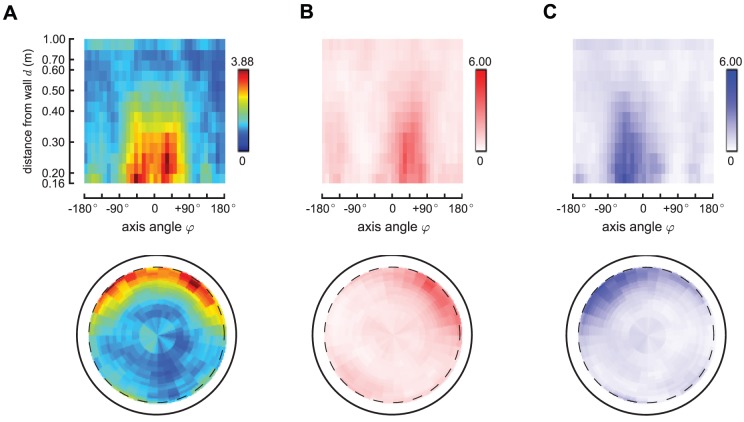
 . This density is obtained by taking the raw number of saccades in each cell
  (Figure 1, Panel E), normalizing by the time spent in each cell
  (Figure 1, Panel D), and then compensating for the interacting nature of the Poisson processes. Panels B–C show the rates for left and right saccades (
 and
and  , respectively), which we plot in red in Panel B (left saccades) and in blue in panel C (right saccades). Note that the left and right saccade ratios appear roughly symmetric.
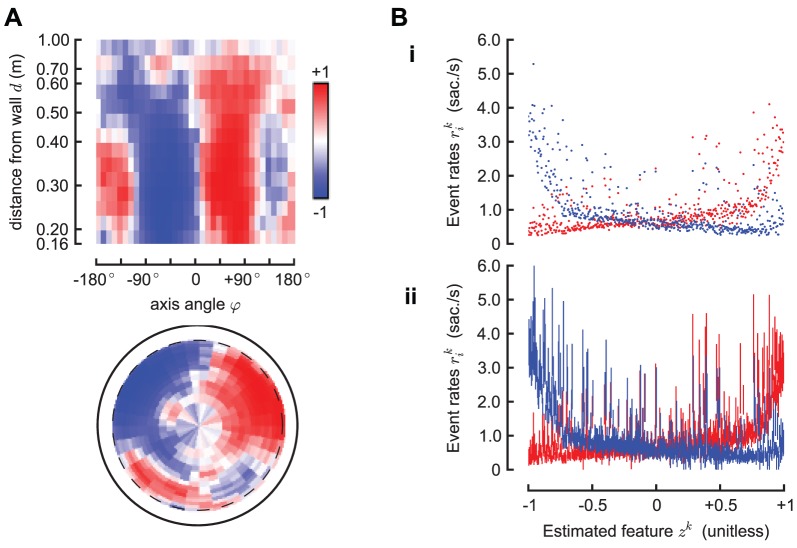
 . Panel A shows the estimated one dimensional feature
  . This is the best one dimensional spatial feature that explains the left and right saccade rates. It is a dimensionless quantity, which we normalize in the interval
  . Panel B-i shows, for each cell
  , the rates
  as a function of the estimated feature
  ; Panel B-ii shows the same data, but with error bars corresponding to 95% confidence intervals (the bars are not symmetric because the posterior distribution of the estimated rates is not Gaussian; see Supplemental Materials for details). The single feature
  is sufficient to predict the rate in
  of the environment, in the sense that
  93% of the rates can be considered (with the error bars) as lying on the same curve; these curves are the functions
  and
and  discussed previously that allow predicting the rates from the feature. The remaining
  of data that this model cannot fit correspond to configurations with the fly pointing directly against the wall at a small distance (<0.3 m).
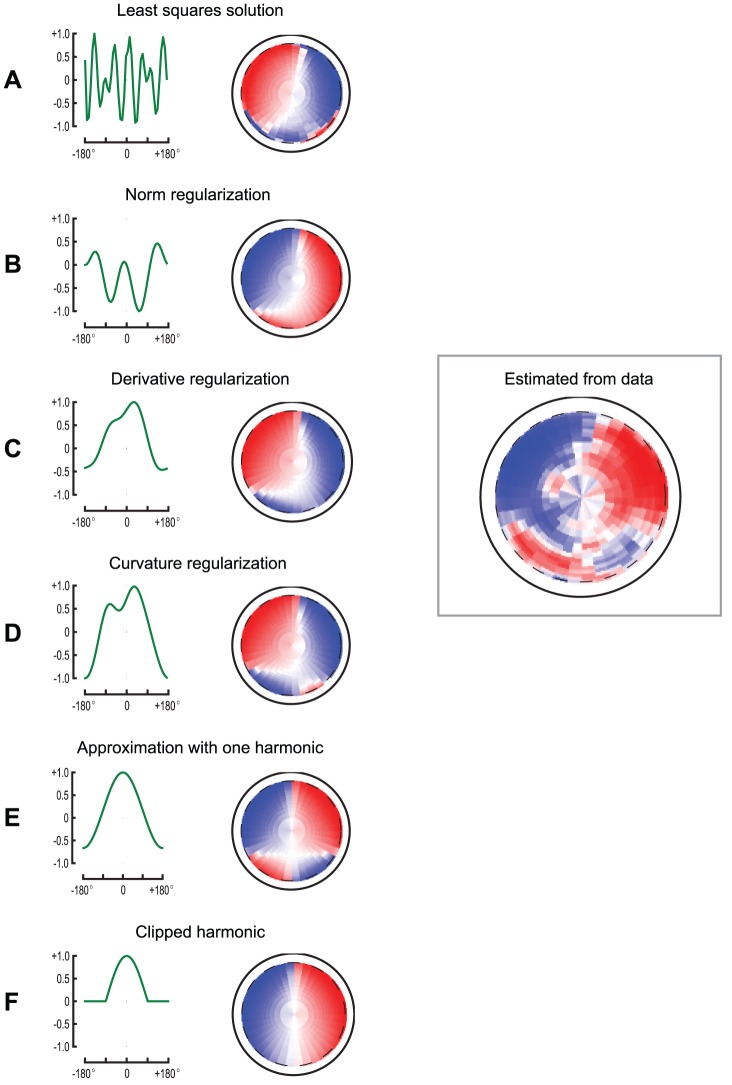
 . These pictures show several receptive fields of wide field motion sensitive cells, the spatial feature that they compute, as well as a comparison with the feature
  identified from the data. The pictures in first column show the kernel
  ; the pictures in the second column show the corresponding feature field. The panels A through D show the kernels obtained as solutions of an optimization problem, respectively by solving a linear least-squares problem (panel A), and three different regularization problems: by penalizing the norm of the solution (panel B), by penalizing the norm of the spatial derivative (panel C), and by penalizing the curvature of the solution (panel D). Note all solutions are asymmetric due to the noise in the data. Panel E shows the kernel
  , which is the closest harmonic function to the regularized solution in panel D. Panel F shows the result obtained by setting to zero this kernel in the back of the field of view. This shows that the contribution of the back of the field of view is necessary to recreate the small sidelobes of the estimated feature field.
References
-
- Berg HC, Brown DA (1972) Chemotaxis in Escherichia coli analysed by Three-dimensional Tracking. Nature 239: 500–504. - PubMed
-
- Tynan CT (1998) Ecological importance of the Southern Boundary of the Antarctic Circumpolar Current. Nature 392: 708–710 doi:10.1038/33675.. - DOI
-
- Menini A, Picco C, Firestein S (1995) Quantal-like current fluctuations induced by odorants in olfactory receptor cells. Nature 373: 435–7 doi:10.1038/373435a0.. - DOI - PubMed
Publication types
MeSH terms
LinkOut - more resources
Full Text Sources
Other Literature Sources
Molecular Biology Databases
Research Materials
