. 2013;9(2):e1003280.
doi: 10.1371/journal.pgen.1003280. Epub 2013 Feb 28.

MSH3 polymorphisms and protein levels affect CAG repeat instability in Huntington's disease mice

Affiliations

MSH3 polymorphisms and protein levels affect CAG repeat instability in Huntington's disease mice

Stéphanie Tomé et al. PLoS Genet. 2013.

Abstract

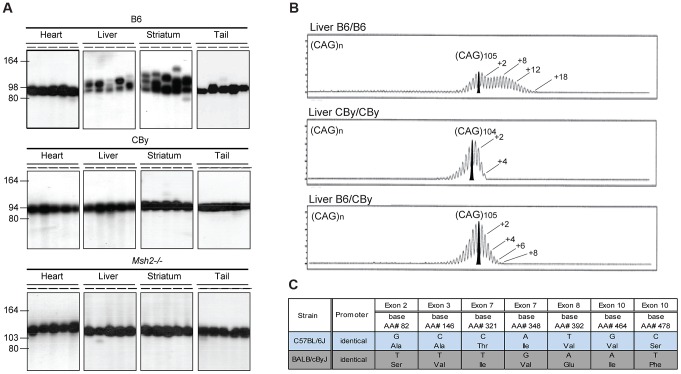
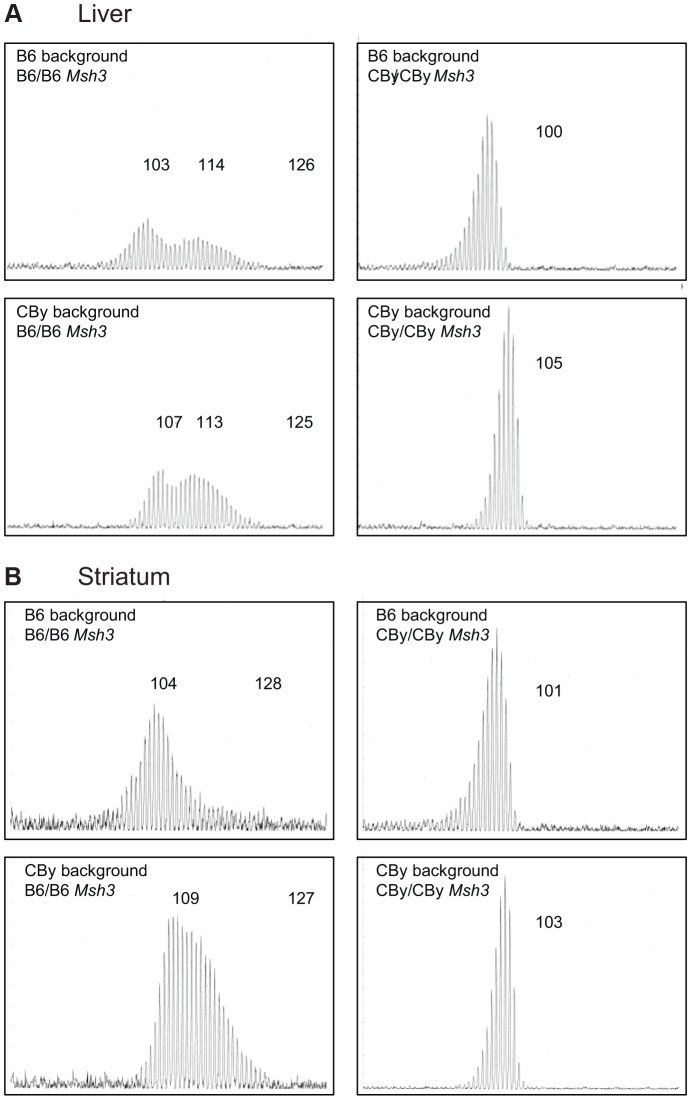
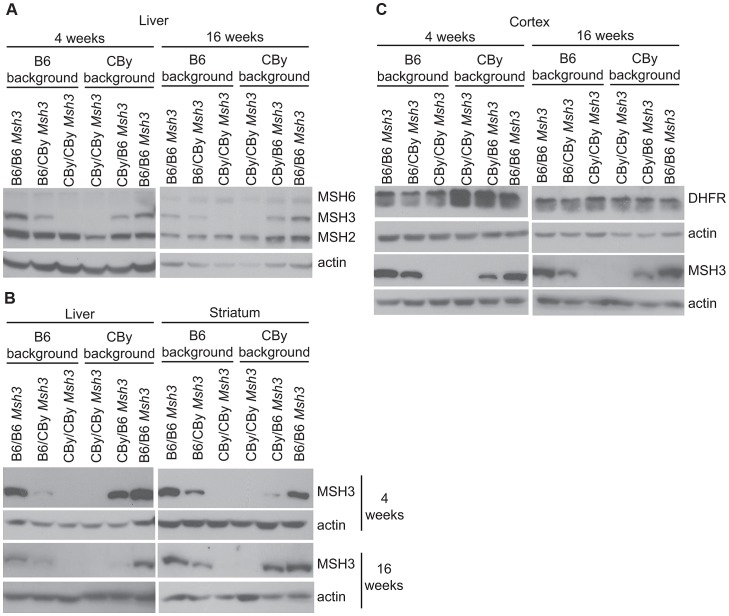
Expansions of trinucleotide CAG/CTG repeats in somatic tissues are thought to contribute to ongoing disease progression through an affected individual's life with Huntington's disease or myotonic dystrophy. Broad ranges of repeat instability arise between individuals with expanded repeats, suggesting the existence of modifiers of repeat instability. Mice with expanded CAG/CTG repeats show variable levels of instability depending upon mouse strain. However, to date the genetic modifiers underlying these differences have not been identified. We show that in liver and striatum the R6/1 Huntington's disease (HD) (CAG)∼100 transgene, when present in a congenic C57BL/6J (B6) background, incurred expansion-biased repeat mutations, whereas the repeat was stable in a congenic BALB/cByJ (CBy) background. Reciprocal congenic mice revealed the Msh3 gene as the determinant for the differences in repeat instability. Expansion bias was observed in congenic mice homozygous for the B6 Msh3 gene on a CBy background, while the CAG tract was stabilized in congenics homozygous for the CBy Msh3 gene on a B6 background. The CAG stabilization was as dramatic as genetic deficiency of Msh2. The B6 and CBy Msh3 genes had identical promoters but differed in coding regions and showed strikingly different protein levels. B6 MSH3 variant protein is highly expressed and associated with CAG expansions, while the CBy MSH3 variant protein is expressed at barely detectable levels, associating with CAG stability. The DHFR protein, which is divergently transcribed from a promoter shared by the Msh3 gene, did not show varied levels between mouse strains. Thus, naturally occurring MSH3 protein polymorphisms are modifiers of CAG repeat instability, likely through variable MSH3 protein stability. Since evidence supports that somatic CAG instability is a modifier and predictor of disease, our data are consistent with the hypothesis that variable levels of CAG instability associated with polymorphisms of DNA repair genes may have prognostic implications for various repeat-associated diseases.


Conflict of interest statement

The authors have declared that no competing interests exist.

Figures

Figure 1
Figure 1. Representative CAG repeat distributions, and Msh3 variations in B6 and CBy mice.
A) The autoradiographs show representative SP-PCR analyses of DNA, extracted from heart, liver, striatum and tail. At weaning the B6.Cg-R6/1 (B6) and CBy.Cg-R6/1 (CBy) congenic mice contained in tail DNA (CAG)98 and (CAG)94, respectively. For comparison the profiles of the Msh2−/− mouse is shown. About 5–10 DNA amplifiable molecules were amplified in each reaction with primers MS-1F and MS-1R. Animals were 20-weeks old. B) Congenic CBy.Cg-R6/1 mice were crossed to B6 and the resulting F1 progeny were crossed to produce F2 mice with all possible genotypes at the Msh3 locus. Repeat instability was assayed by amplifying 10 ng genomic DNA using fluorescently labelled primers and resolving the fragments by capillary gel electrophoresis (Figure 1B). Using this high-resolution approach repeat length distributions present with the typical ‘hedgehog’ pattern (e.g. , , , . This pattern reflects both somatic mosaicism within the sample and PCR artefacts generated by Taq polymerase slippage , . The PCR artefacts are predominantly repeat contractions, hence these are not considered here. The pattern of CAG repeat instability depended on genotype at the MSH3 locus. B6 homozygosity resulted in the greatest instability, CBy homozygosity resulted in lack of expansion, while heterozygosity resulted in an intermediate instability, indicative of a gene dosage effect of the Msh3 locus. Numbers indicate the CAG repeat size corresponding to major peaks. In addition, on the B6 tracing, a second number indicates the highest CAG repeat number detected. C) Msh3 polymorphisms in Msh3 gene from C57BL/6 (B6) and BALB/cBy (CBy) mice. Promoters were identical. SNPs were identified or confirmed to those in dbSNP by sequencing the Msh3 gene.
Figure 2
Figure 2. Representative CAG repeat distributions from reciprocal Msh3 congenic lines of mice.
Typical GeneScan traces for sizing of the CAG repeat as outlined in Figure 1B. Liver (A) and Striatum (B) from 16–20 week old R6/1 transgenic mice showing the effect of homozygosity at the Msh3 locus on the pattern of expansion in the reciprocal congenic mice. Regardless of genetic background, CBy homozygosity at the congenic locus results in loss of somatic expansion, while B6 homozygosity is permissive of somatic expansion.
Figure 3
Figure 3. Western blot analysis of MMR and DHFR protein levels.
MMR expression in liver and striatum from 4 and 16 week-old mouse. Actin was used as a loading control. MSH2: 104 kD, MSH6: 160 kD, MSH3: 127 kD (Ab = 2F11) and actin: 42 kD. DHFR expression in cortex from 4 and 16 week-old mice DHFR: 21 kD. A) Simultaneous Western blot using MSH2-, MSH3-, MSH6- and actin-specific antibodies in liver. For antibody dilutions see Materials and methods. B) Western blot using only anti-MSH3 (Ab = 2F11) and actin antibodies in liver and striatum. C) Western blot analysis of DHFR in cortex from 4 and 16 week-old mice.
Figure 4
Figure 4. MSH3 coding polymorphisms and protein expression in different mouse strains.
A) Msh3 polymorphisms in Msh3 gene from C57BL/6 (B6) and BALB/cBy (CBy) mice. Promoters were identical. SNPs were identified or confirmed to those in dbSNP by sequencing the Msh3 gene. In DBA/2J, exon 8, AA#392 was correctly identified to be T/Valine. For a given amino acid the same codon was used for the variants. The complete set of MSH3 protein polymorphisms in 14 mouse strains is in Table S2. B) MSH3 expression in spleen extract from different background using two different MSH3 antibodies . The faster migrating band for 5A5 was a non-specific cross-reacting product, as described for 5A5 but not 2F11 . All other figures in this study used 2F11. C) Typical GeneScan traces for sizing of the CAG repeat as outlined in Figure 1B. Representative CAG repeat distributions from liver of F1 progeny between CBy and other inbred strains of mice. The top, bottom and second panel show the controls CBy (stable), B6 (unstable), and CBy X B6 (intermediate) CAG profiles, respectively. Note: Western blot data comes from inbred mice. The higher levels of MSH3 in C3H and B6 are halved in the cross to CBy.
Figure 5
Figure 5. Structural and sequence analysis of MSH3.
A: Multiple sequence alignment of MSH3. Jalview created visualization using the first 500 amino acids of the mouse B6 MSH3 (NP_034959.2). Conservation values and consensus sequence are based on alignment of S. cerevisiae Msh3p, E. coli MutS and 17 mammalian MSH3 homologs; values range from 0–9, where 0 is lowest and 9 is the highest. Protein interacting domains indicated pertain to those regions of the human MSH3 protein. This panel only shows an abbreviated set of the species of MSH3 sequence, the full set analysed is shown in Figure S5. B: MSH3 variant within β-turn. The T321I variant occurs within a Type I β-turn, as determined by specific backbone turn angles , from the human MSH3 structure (3THW_B). Top left: hMSH3 tube diagram of Cα atoms of β-turn (blue), i+2 (T) residue (red) and additional three residues on N- and C-terminal ends (green). Bottom left table shows the β-turn propensity is relatively strong throughout MutS/MSH3 homologs, while the CBy variant (Isoleucine at i+2 position) is extremely disfavored (table bottom left) . Right: Ball and stick diagram of contact sites of Asp (D) and Thr (T) residues in β-turn with residues 194 and 214 respectively. Line diagram of Thr (T) hydroxyl group contact with neighbouring Threonine residue at position 365. The absence of the Threonine hydroxyl group may be important to stabilizing the β-turn itself, and/or may change the conformation of the turn, potentially disrupting distant contacts important for proper protein folding. MSH3 visualizations created using PyMol (PyMOL Molecular Graphics System, Version 1.2r3pre, Schrödinger, LLC).

References

    1. Lee JM, Ramos EM, Lee JH, Gillis T, Mysore JS, et al. (2012) CAG repeat expansion in Huntington disease determines age at onset in a fully dominant fashion. Neurology 78: 690–695. - PMC - PubMed
    1. Rosenblatt A, Kumar BV, Mo A, Welsh CS, Margolis RL, et al. (2012) Age, CAG repeat length, and clinical progression in Huntington's disease. Mov Disord 27: 272–276. - PubMed
    1. Telenius H, Kremer B, Goldberg YP, Theilmann J, Andrew SE, et al. (1994) Somatic and gonadal mosaicism of the Huntington disease gene CAG repeat in brain and sperm. Nat Genet 6: 409–414. - PubMed
    1. De Rooij KE, De Koning Gans PA, Roos RA, Van Ommen GJ, Den Dunnen JT (1995) Somatic expansion of the (CAG)n repeat in Huntington disease brains. Hum Genet 95: 270–274. - PubMed
    1. Kennedy L, Evans E, Chen CM, Craven L, Detloff PJ, et al. (2003) Dramatic tissue-specific mutation length increases are an early molecular event in Huntington disease pathogenesis. Hum Mol Genet 12: 3359–3367. - PubMed

Publication types