. 2013;9(2):e1003301.
doi: 10.1371/journal.pgen.1003301. Epub 2013 Feb 28.

Deleterious alleles in the human genome are on average younger than neutral alleles of the same frequency

Collaborators, Affiliations

Deleterious alleles in the human genome are on average younger than neutral alleles of the same frequency

Adam Kiezun et al. PLoS Genet. 2013.

Abstract

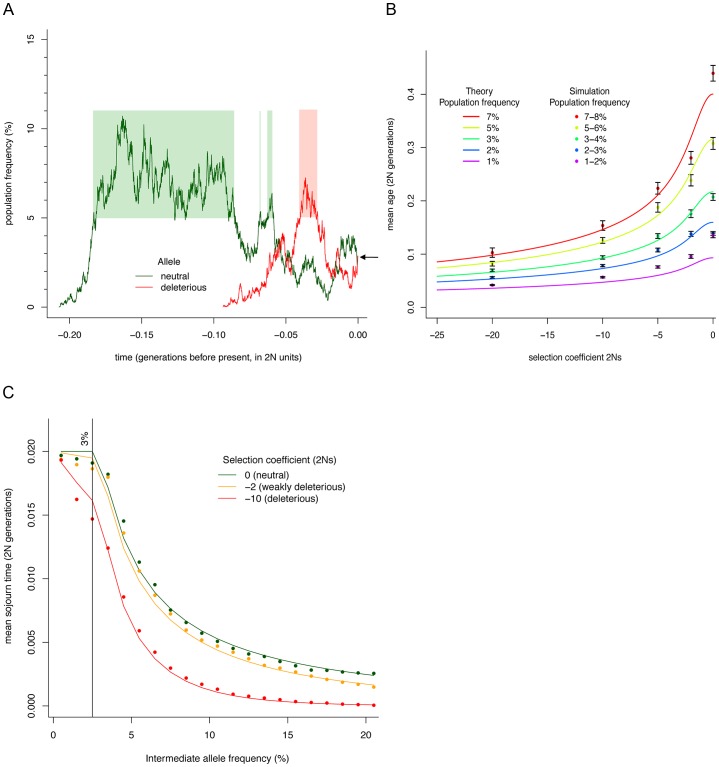
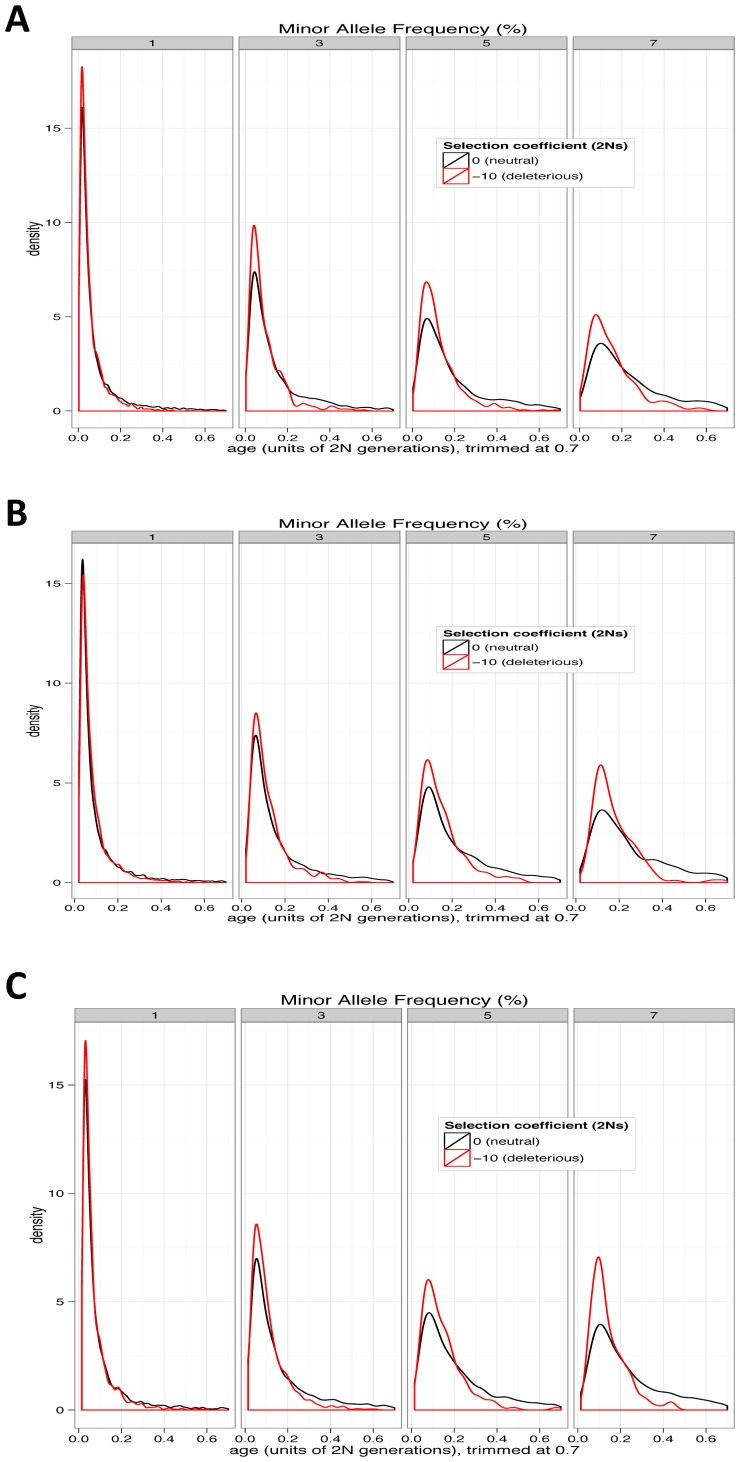
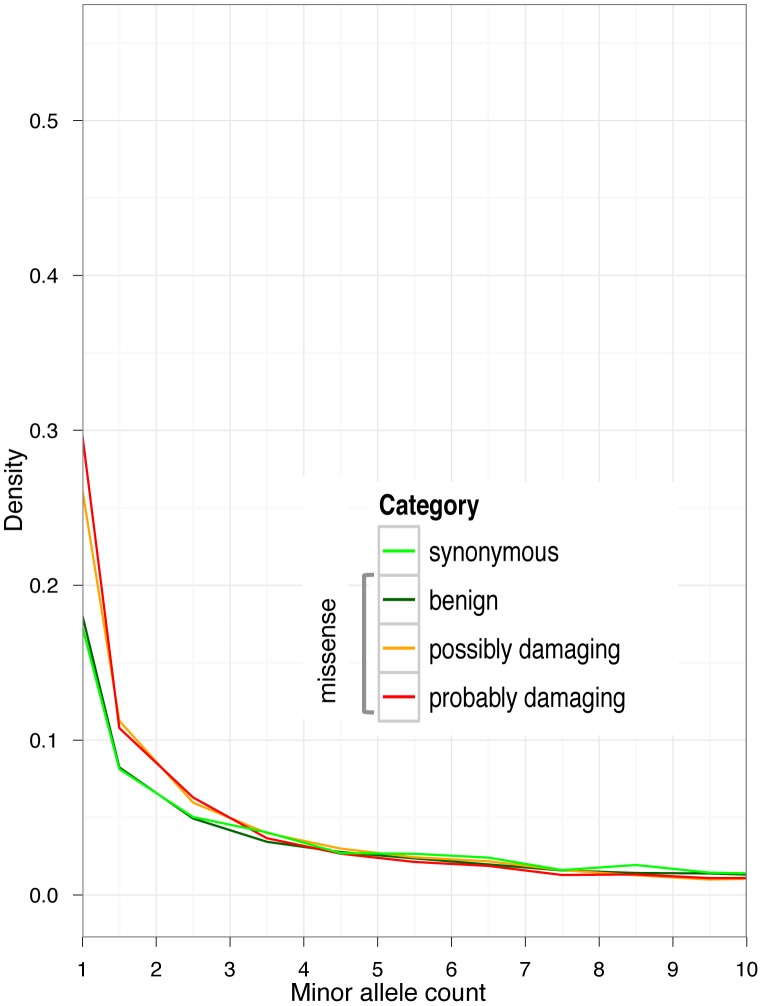
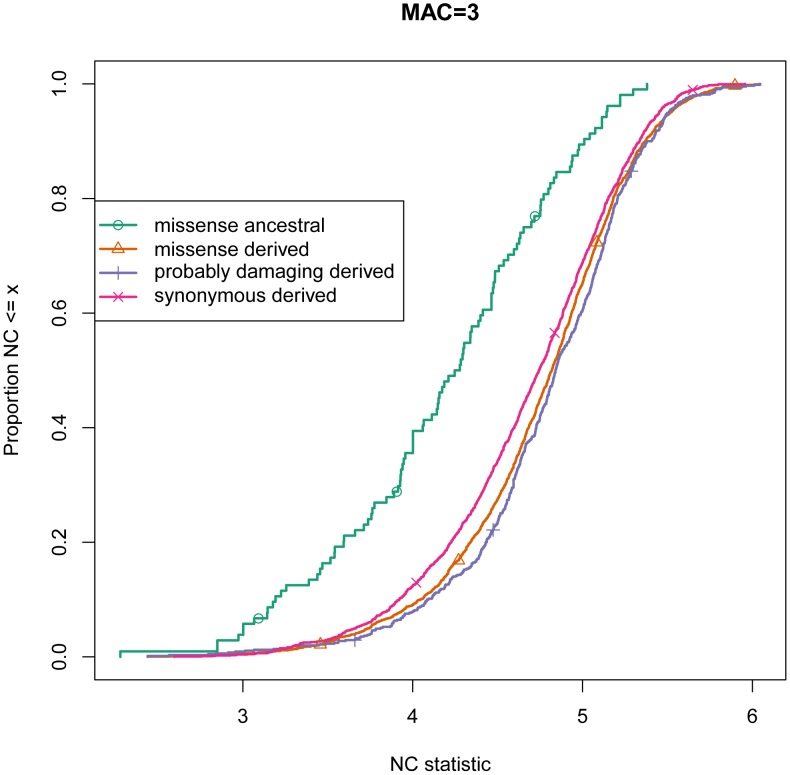
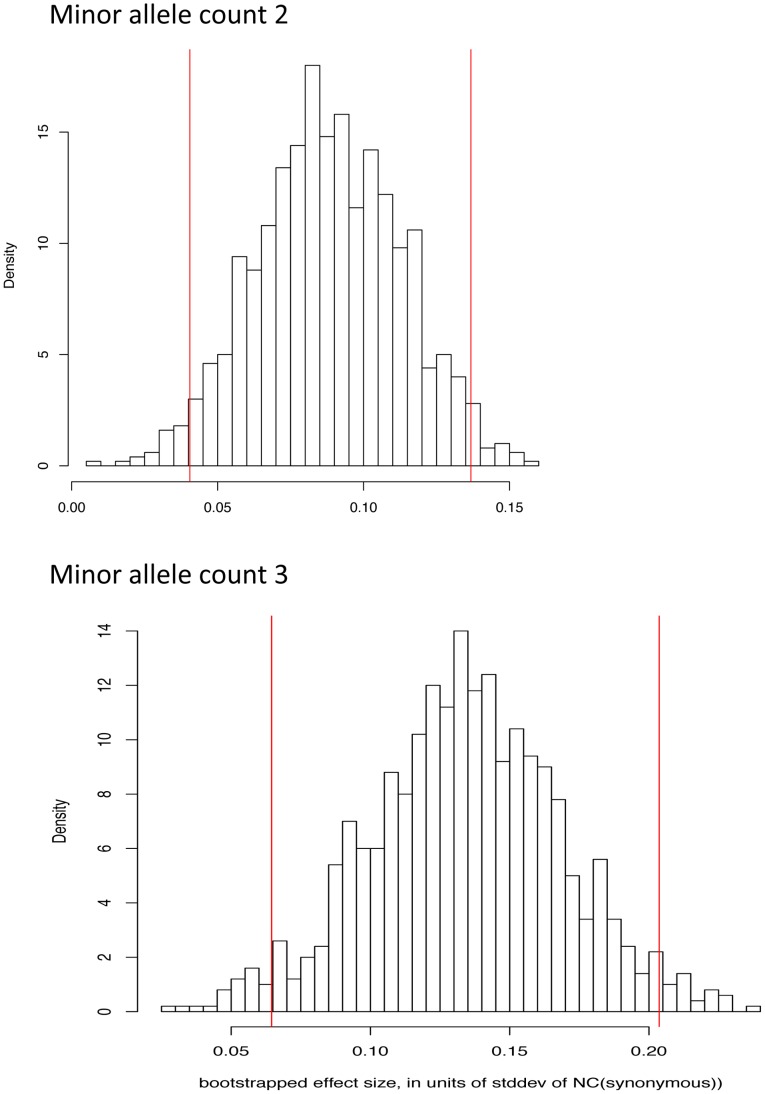
Large-scale population sequencing studies provide a complete picture of human genetic variation within the studied populations. A key challenge is to identify, among the myriad alleles, those variants that have an effect on molecular function, phenotypes, and reproductive fitness. Most non-neutral variation consists of deleterious alleles segregating at low population frequency due to incessant mutation. To date, studies characterizing selection against deleterious alleles have been based on allele frequency (testing for a relative excess of rare alleles) or ratio of polymorphism to divergence (testing for a relative increase in the number of polymorphic alleles). Here, starting from Maruyama's theoretical prediction (Maruyama T (1974), Am J Hum Genet USA 6:669-673) that a (slightly) deleterious allele is, on average, younger than a neutral allele segregating at the same frequency, we devised an approach to characterize selection based on allelic age. Unlike existing methods, it compares sets of neutral and deleterious sequence variants at the same allele frequency. When applied to human sequence data from the Genome of the Netherlands Project, our approach distinguishes low-frequency coding non-synonymous variants from synonymous and non-coding variants at the same allele frequency and discriminates between sets of variants independently predicted to be benign or damaging for protein structure and function. The results confirm the abundance of slightly deleterious coding variation in humans.


Conflict of interest statement

The authors have declared that no competing interests exist.

Figures

Figure 1
Figure 1. Simulation and theoretical results for allelic age and sojourn times.
a. Example trajectories for a neutral and deleterious allele with current population frequencies 3% (indicated by the arrow). The shaded areas indicate sojourn times at frequencies above 5%. b. Mean ages for neutral and deleterious alleles at a given population frequency (lines show theoretical predictions, dots show simulation results with standard error bars). Simulation results are averages of alleles in a frequency range, while theoretical prediction are for alleles at a fixed frequency. The graph shows that deleterious alleles at a given frequency are younger than neutral alleles, and that the effect is greater for more strongly selected alleles. c. Mean sojourn times for neutral and deleterious alleles. Vertical line denotes the current population frequency of the variant (3%). Mean sojourn times have been computed in bins of 1%. Line connects theoretical predictions for each frequency bin. Dots show simulation results. The graph illustrates that deleterious alleles spend much less time than neutral alleles at higher population frequencies in the past even if they have the same current frequency.
Figure 2
Figure 2. Age distributions for neutral and deleterious alleles from simulations.
(A) Constant-size, (B) recently rapidly expanding population, and (C) bottleneck followed by rapid expansion. For presentation, distributions are trimmed. Deleterious alleles in all cases are younger than neutral alleles at the same frequency, though the effect is weaker in rapidly expanding populations.
Figure 3
Figure 3. Cartoon presentation of the NC statistic.
The NC statistic aims to capture the length of the haplotype carrying a variant. For a given variant (called the index variant, shown in the middle of the figure), the value of the NC statistic is the base-10 logarithm of the sum of physical distances measured up-stream (5′ direction) and down-stream (3′ direction) from the index variant to the closest variant that is either beyond a recombination spot (example shown on the left) or is linked to the index variant but is rarer than the index variant (example shown on the right). The red arrow in the figure illustrates that sum of the two distances.
Figure 4
Figure 4. Allele frequency spectra in GoNL data, for synonymous alleles and non-synonymous alleles stratified by PolyPhen-2 functional predictions.
For better presentation, the graphs have been cropped at minor allele count 10.
Figure 5
Figure 5. Empirical Cumulative Distribution Function of the NC statistic for alleles at minor allele count 3 in GoNL data.
Synonymous derived variants serve as the baseline distribution. The distribution of NC for probably damaging derived missense variants is notably shifted towards higher values, consistent with their younger age. The NC-statistic distribution for ancestral alleles are at minor allele count 3 is strongly shifted towards lower values, consistent with much older age of those alleles.
Figure 6
Figure 6. Bootstrap distribution of normalized difference between NC statistic on missense and synonymous variants for derived allele count 2 and 3.
Vertical red bars indicate 95% confidence intervals. For presentation, panels have been aligned along the X axis.
Figure 7
Figure 7. Allele frequency spectra and population-private coding alleles.
The graphs show the proportion of population-private synonymous alleles and non-synonymous alleles stratified by PolyPhen-2 functional predictions.

References

    1. Fay JC, Wyckoff GJ, Wu CI (2001) Positive and negative selection on the human genome. Genetics 158: 1227–1234. - PMC - PubMed
    1. Sunyaev S, Ramensky V, Koch I, Lathe W, Kondrashov AS, et al. (2001) Prediction of deleterious human alleles. Human Molecular Genetics 10: 591–597. - PubMed
    1. Williamson SH, Hernandez R, Fledel-Alon A, Zhu L, Nielsen R, et al. (2005) Simultaneous inference of selection and population growth from patterns of variation in the human genome. Proc Natl Acad Sci USA 102: 7882–7887. - PMC - PubMed
    1. Eyre-Walker A, Woolfit M, Phelps T (2006) The Distribution of Fitness Effects of New Deleterious Amino Acid Mutations in Humans. Genetics 173: 891–900. - PMC - PubMed
    1. Kryukov GV, Pennacchio LA, Sunyaev SR (2007) Most rare missense alleles are deleterious in humans: implications for complex disease and association studies. The American Journal of Human Genetics 80: 727–739. - PMC - PubMed

Publication types