. 2013;9(2):e1003302.
doi: 10.1371/journal.pgen.1003302. Epub 2013 Feb 28.

FAM20A mutations can cause enamel-renal syndrome (ERS)

Affiliations

FAM20A mutations can cause enamel-renal syndrome (ERS)

Shih-Kai Wang et al. PLoS Genet. 2013.

Abstract

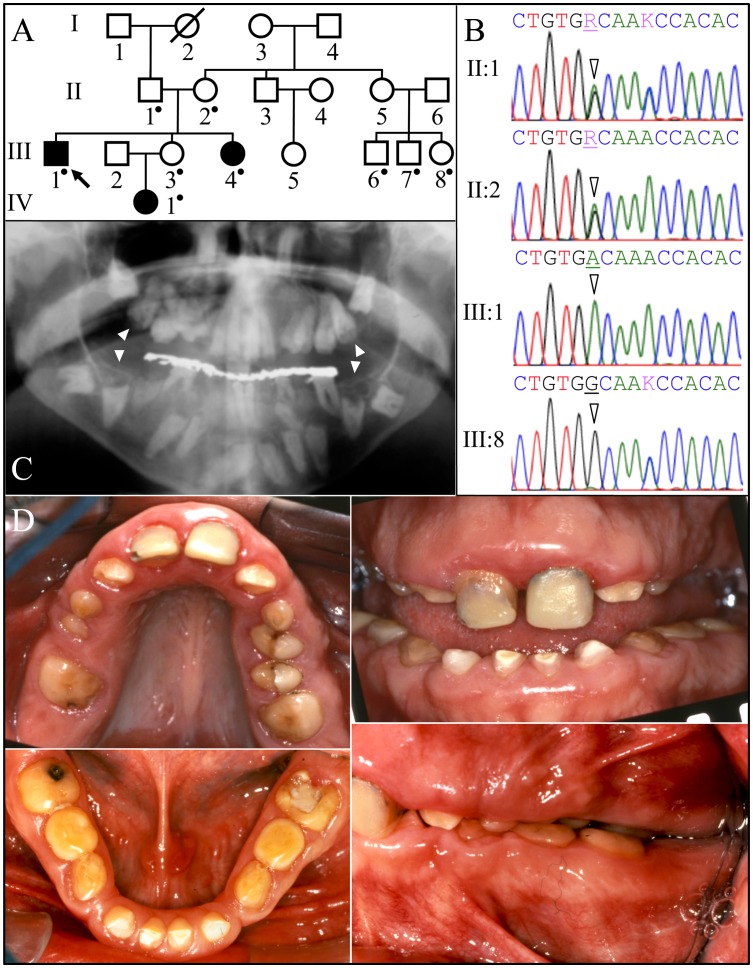
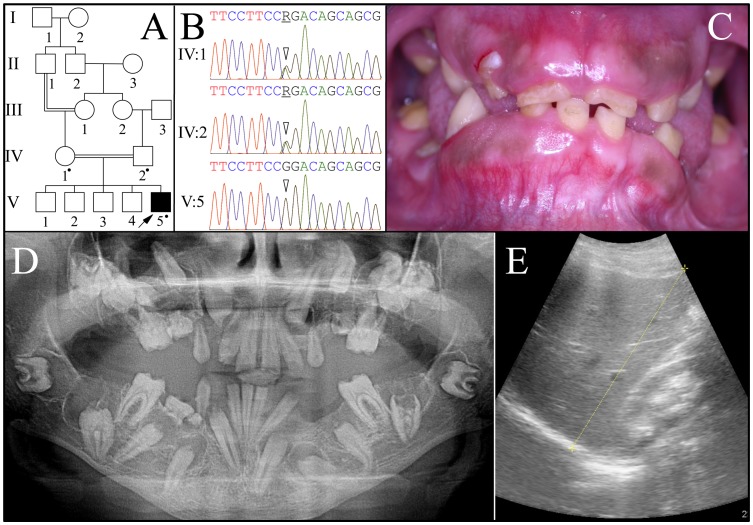
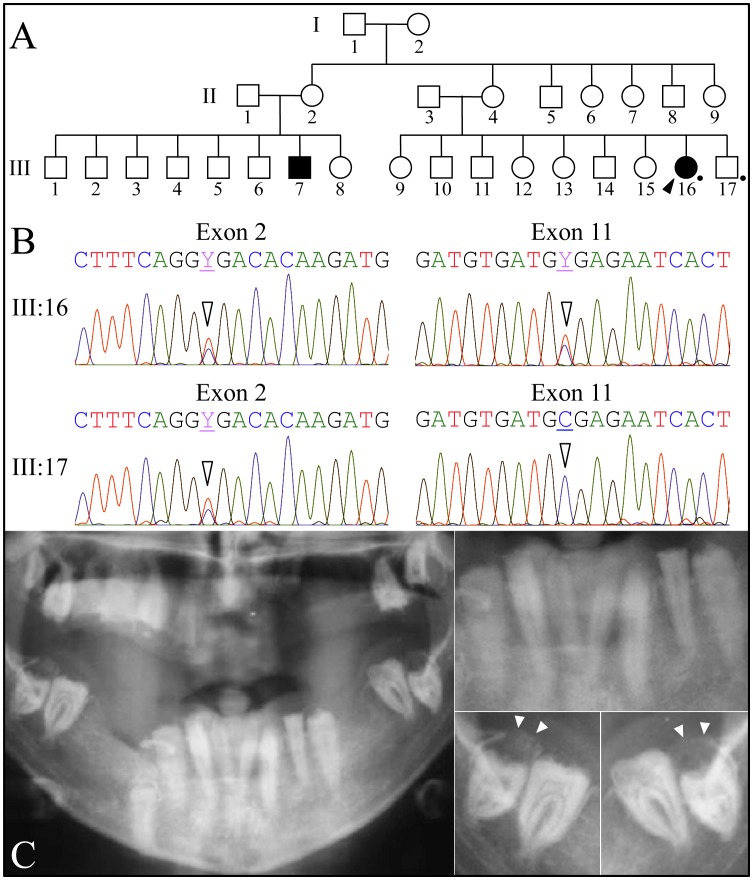
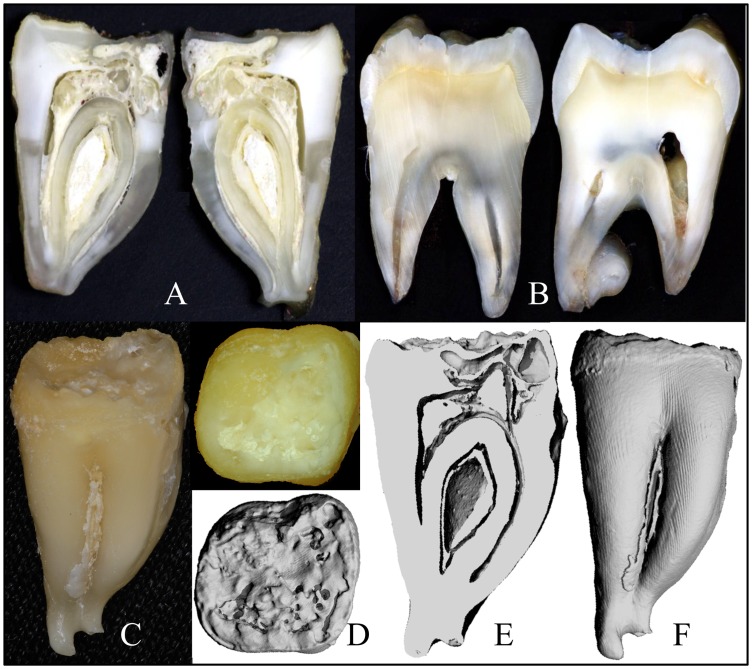
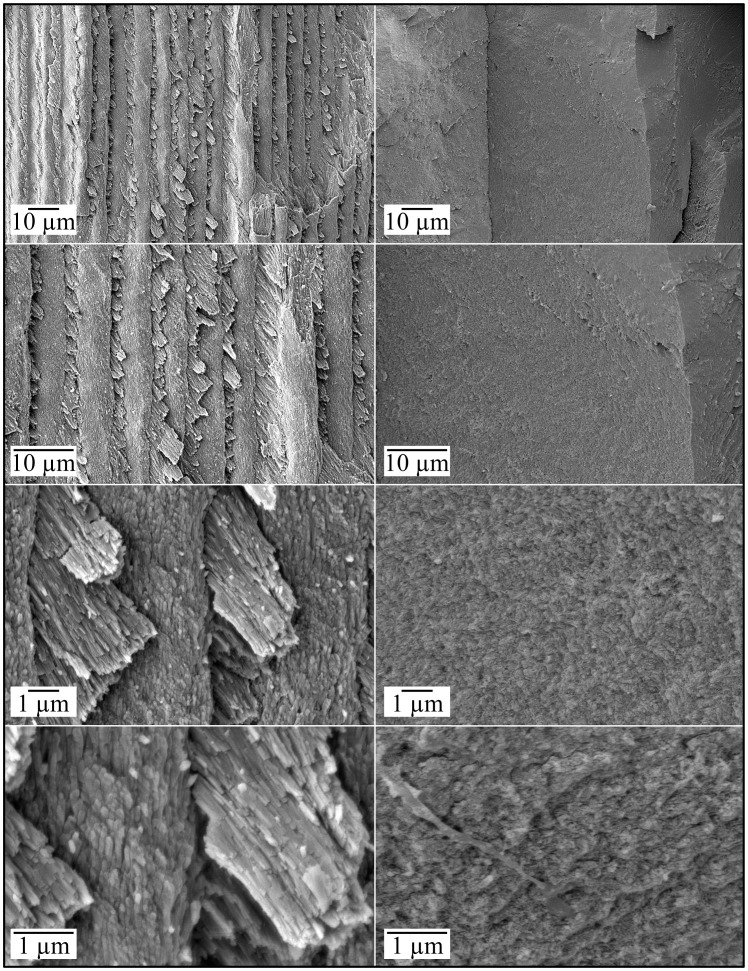
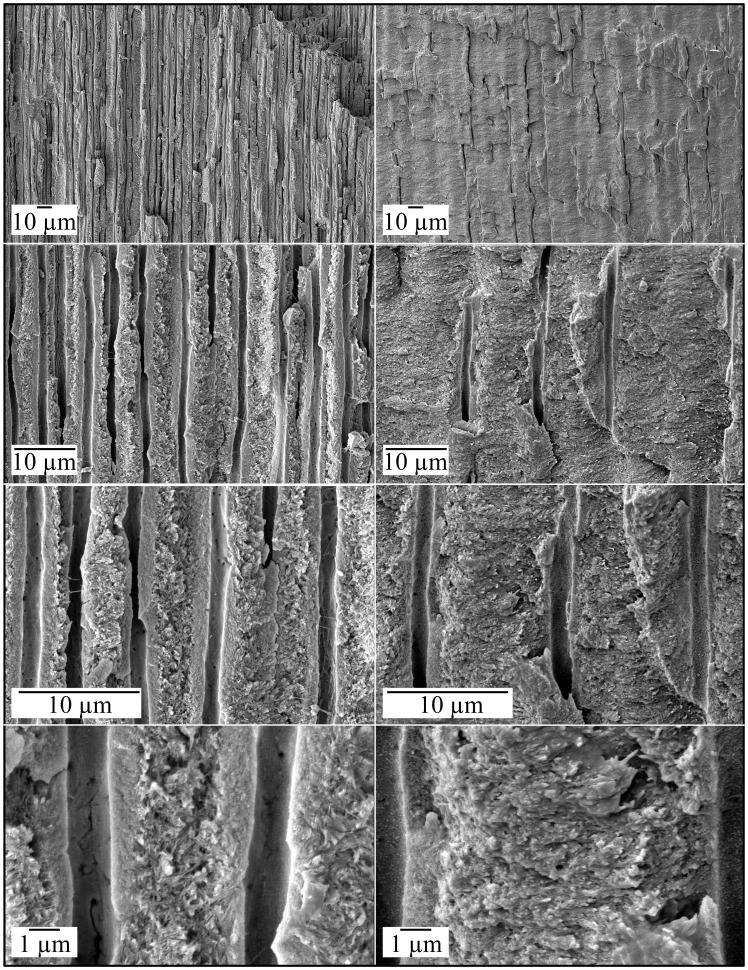
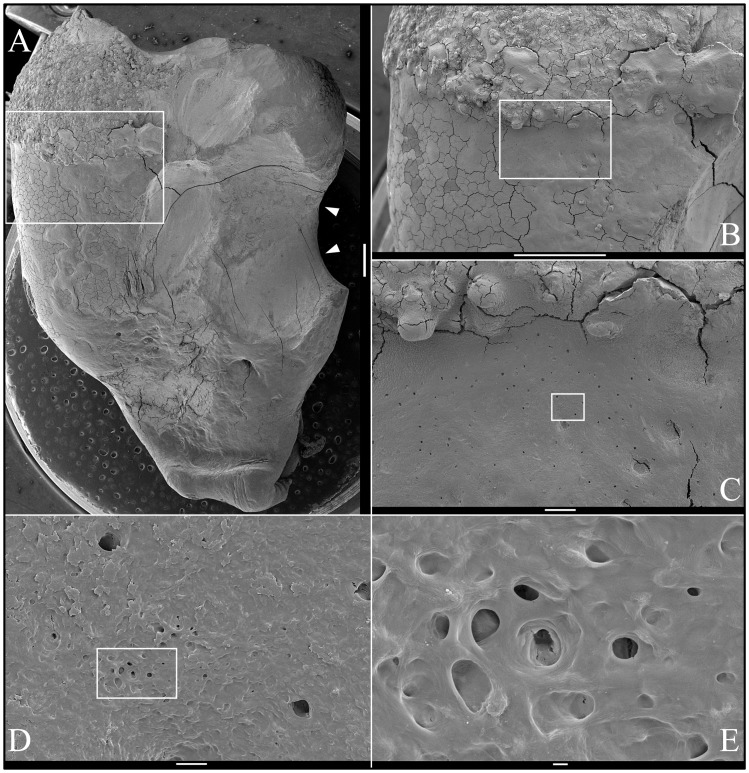
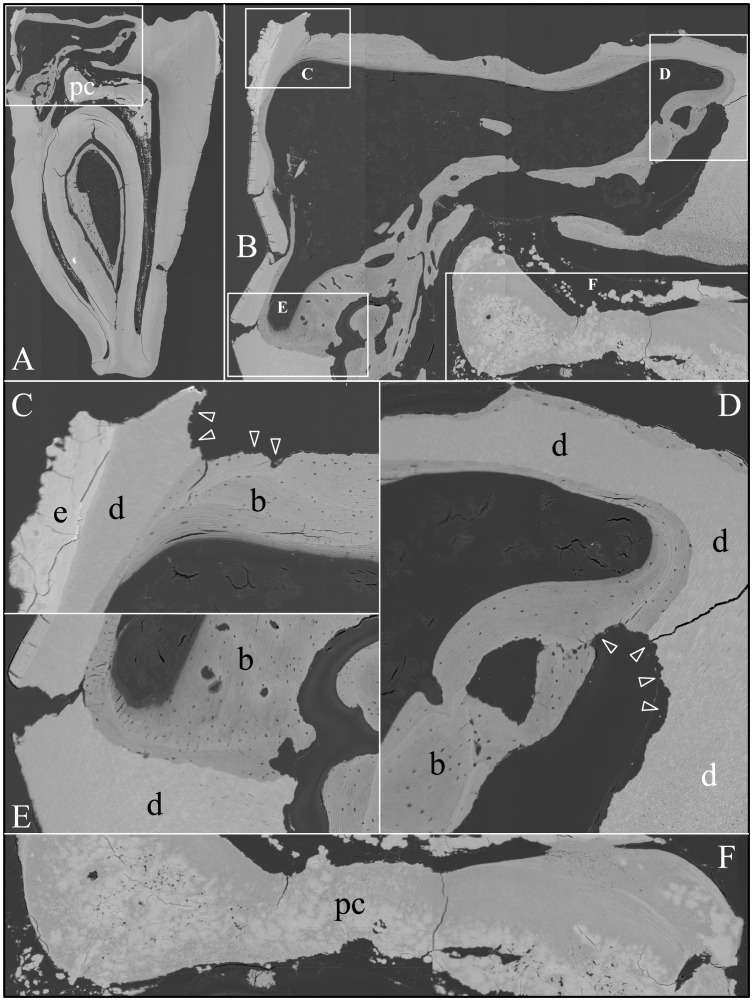
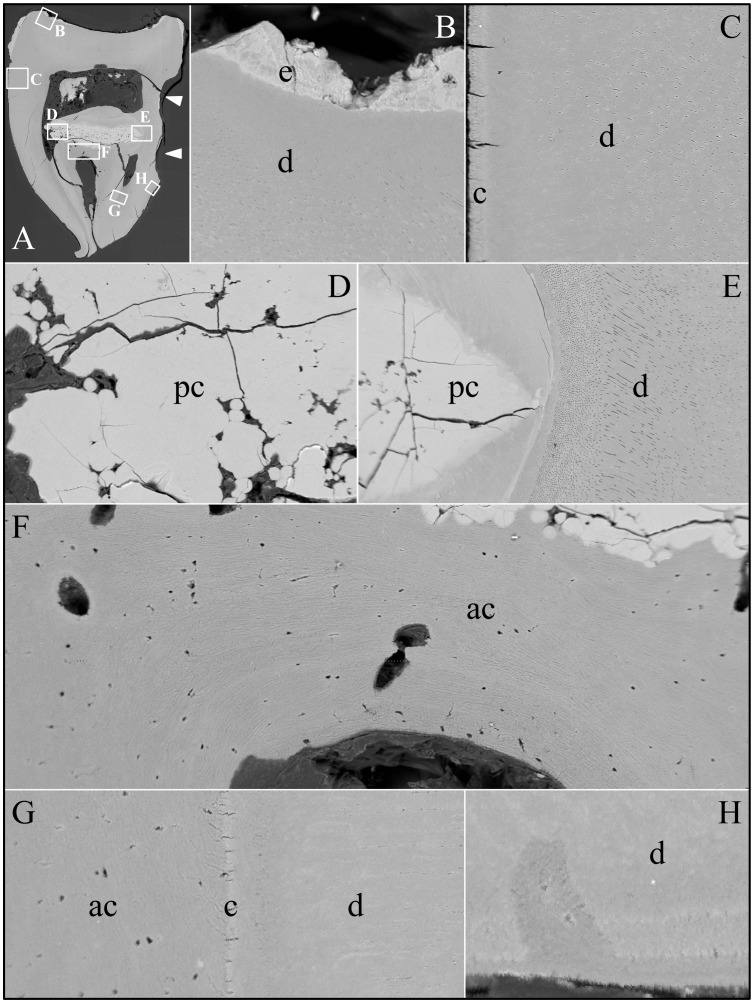
Enamel-renal syndrome (ERS) is an autosomal recessive disorder characterized by severe enamel hypoplasia, failed tooth eruption, intrapulpal calcifications, enlarged gingiva, and nephrocalcinosis. Recently, mutations in FAM20A were reported to cause amelogenesis imperfecta and gingival fibromatosis syndrome (AIGFS), which closely resembles ERS except for the renal calcifications. We characterized three families with AIGFS and identified, in each case, recessive FAM20A mutations: family 1 (c.992G>A; g.63853G>A; p.Gly331Asp), family 2 (c.720-2A>G; g.62232A>G; p.Gln241_Arg271del), and family 3 (c.406C>T; g.50213C>T; p.Arg136* and c.1432C>T; g.68284C>T; p.Arg478*). Significantly, a kidney ultrasound of the family 2 proband revealed nephrocalcinosis, revising the diagnosis from AIGFS to ERS. By characterizing teeth extracted from the family 3 proband, we demonstrated that FAM20A(-/-) molars lacked true enamel, showed extensive crown and root resorption, hypercementosis, and partial replacement of resorbed mineral with bone or coalesced mineral spheres. Supported by the observation of severe ectopic calcifications in the kidneys of Fam20a null mice, we conclude that FAM20A, which has a kinase homology domain and localizes to the Golgi, is a putative Golgi kinase that plays a significant role in the regulation of biomineralization processes, and that mutations in FAM20A cause both AIGFS and ERS.


Conflict of interest statement

The authors have declared that no competing interests exist.

Figures

Figure 1
Figure 1. Family 1 from the Caribbean with FAM20A mutation c.992G>A; g.63853G>A; p.G331D.
A: Pedigree. A dot marks person who donated samples for DNA sequencing. B: FAM20A exon 7 DNA sequencing chromatograms. The proband's parents (II:1 and II:2) were both heterozygous (R = A or G) at cDNA position 992 (arrowheads). The proband (III-1) had the c.992G>A transition mutation in both alleles of FAM20A. This mutation changed a conserved glycine with an aspartic acid (p.G331D). The proband's affected younger sister (III-4) and her infant niece (IV:1) were also homozygous for this mutation (not shown). II:1 and III:8 were heterozygous for a recognized polymorphism (rs2302234) in exon 7 (K = A or C) unrelated to the phenotype. C: Proband's panoramic radiograph. Note the many unerupted teeth. The mandibular and maxillary unerupted second molars show concave occlusal surfaces without enamel (arrowheads). D: Proband's oral photos. The maxillary central incisors are restored. The clinical crowns were short with hypoplastic enamel. There was a deep anterior overbite, a posterior cross-bite, and retained mandibular primary molars (letters K, L, S, T).
Figure 2
Figure 2. Family 2 from Jordan with FAM20A mutation c.720-2A>G; g.62232A>G; p.Q241_R271del.
A: Pedigree: a dot marks person who donated samples for DNA sequencing. B: FAM20A intron 4 DNA sequencing chromatograms. The proband's parents (IV:1 and IV:2) were both heterozygous (R = A or G) at cDNA position 720 (2 arrowheads). The proband (V:5) had the c.720-2A>G transition mutation in both alleles of FAM20A. This mutation is predicted to cause the skipping of exon 5, which is predicted to delete 31 amino acids (Q241-R271) from the protein without shifting the reading frame. C: Proband's oral photo showing enamel hypoplasia, gingival enlargement and failed eruption. D: Proband's panoramic radiograph. Note the enamel hypoplasia, pulp calcifications, and unerupted teeth with pericoronal radiolucencies delimited by sclerotic borders. The left mandibular second molar (#18) shows apparent crown resorption. E: Ultrasound of proband's right kidney, located to the right of the yellow line.
Figure 3
Figure 3. Family 3 from Iran with FAM20A nonsense mutations in exon 2 (c.406C>T; g.50213C>T; p.R136*) and in exon 11 (c.1432C>T; g.68284C>T; p.R478*).
A: Pedigree consistent with a recessive pattern of inheritance. B: Exon 2 (left) and exon 11 DNA sequencing chromatograms. The proband (III:16) is heterozygous for nonsense mutations in exon 2 (c.406C>T) and exon 11 (c.1432C>T). The unaffected brother (III:17) is only heterozygous for the c.406C>T mutation in exon 2. C: Panoramic radiograph of proband. Note the lack of enamel, pericoronal radiolucencies over the unerupted mandibular third molars (arrowheads), and apparent crown resorption of the left mandibular second molar (#18).
Figure 4
Figure 4. Images of FAM20A −/− tooth #18.
A: Photographs of #18 after cutting it sagitally. B: Photographs of a wild-type molar after cutting it sagitally. C: Photograph of #18 before sectioning. D: Occlusal view of #18 by photograph (top) and 3-D μ-CT image. E: 3-D μ-CT image of inside #18. Note the hollow area in the crown and the calcified pulp chamber. F: 3-D μ-CT image of #18. Note the shortness of the crown, which as apparently greatly diminished by resorption.
Figure 5
Figure 5. Scanning Electron Micrographs (SEMs) of molar (#18) occlusal surface.
A: Low magnification view of occlusal surface after partially cutting and then splitting the tooth sagitally (mesial-distal direction) for SEM analyses (bar: 1 mm). The boxes, from top to bottom, are locations of higher magnification views shown in B–E, respectively. B: Region showing knob-like calcifications (bar: 100 µm). C: Region where dentinal tubules reach the surface (bar: 10 µm); D: Region showing a relatively smooth surface (bar: 10 µm). E: Region from edge of crown (bar: 100 µm); F: Higher magnification of box in panel E showing no true enamel and apparent resorption lacunae (bar: 10 µm).
Figure 6
Figure 6. Scanning Electron Micrographs (SEMs) of mineral covering coronal dentin in a molar (#18) split for SEM examination.
Left: Enamel layer in normal molar Right: Mineral covering dentin in FAM20 −/− molar. No long thin crystals with rod/interrod organization are observed in the FAM20 −/− molar.
Figure 7
Figure 7. Scanning Electron Micrographs (SEMs) of dentin in a molar (#18) split for SEM examination.
Left: Dentin in normal molar Right: Dentin in FAM20 −/− molar. Dentin appears to be normal in the FAM20 −/− molar.
Figure 8
Figure 8. Scanning Electron Micrographs (SEMs) of molar (#32) showing root resorption.
A: Mesial surface (bar: 1 mm). Large area of suspected root resorption (arrowheads). B: Higher magnification of region boxed in A (bar: 1 mm). Mineral covering dentin has knobby texture, while the root surface below the cervical margin appears to be smooth. C: Higher magnification of region boxed in B (bar: 100 µm). The apparently smooth root surface has surface craters and pits that look increasingly like resorption lacunae at higher magnification. D: Higher magnification of region boxed in C (bar: 10 µm). E: Higher magnification of region boxed in D (bar: 1 µm).
Figure 9
Figure 9. Backscatter Scanning Electron Micrographs (bSEMs) of molar (#18) crown.
A: The bSEM of molar after it was cut sagitally (mesial-distally). B: Higher magnification of region boxed in A showing regions magnified in C–F. The bowtie-shaped structure in the lower right is the calcified pulp chamber. Most of the coronal dentin has been resorbed, with some of it replaced by well-formed lamellar bone (b). C–E: Region showing dense, rough, crusty mineral in place of enamel (e) covering sclerotic dentin (d) that is fused to lamellar bone (b). There appears to be sites of active resorption of the dentin and bone (arrowheads). F: The pulp calcification (pc) is comprised of coalesced spheres that resemble the crusty “enamel” in mineral density embedded in a second, less mineralized material like dentin or acellular cementum that lacks osteocyte lacunae.
Figure 10
Figure 10. Backscatter Scanning Electron Micrographs (bSEMs) of molar (#18) roots.
A: The bSEM of molar after it was cut sagitally (mesial-distally). B: Higher magnification of smaller box in A showing the layered build-up resembling cellular cementum. Arrowheads mark the dentin-cementum border. C–D: Higher magnifications of the larger box in A showing the thick layers of “cellular cementum” covering the roots. In panel D a dark line is placed at the dentin surface. E: Higher magnification of the larger box in panel C showing the thick layers of “cellular cementum” covering the roots and how the lamellar pattern suggests that deposition of these layers was punctuated by periods of resorption that sometimes penetrated into the dentin. F–G: Higher magnification of the smaller box in panel C also showing how deposition of the layers of acellular cementum was punctuated by resorption that sometimes penetrated into the dentin.
Figure 11
Figure 11. Backscatter Scanning Electron Micrographs (bSEMs) of molar (#32).
A: The bSEM of molar after it was cut sagitally (mesial-distally). B: Rough “enamel” (e) covering sclerotic dentin. C: Acellular cementum covering sclerotic root dentin. D–E: Highly mineralized pulp or radicular calcifications (pc) comprised of coalesced spheres above the root furcation and associated with a less mineralized material that contacts dentin (d). F: The radicular area appears to be comprised entirely of acellular cementum (ac) or lamellar bone from the furcation to the highly mineralized coalesced spheres. G: Root dentin covered with a thick layer of acellular cementum (ac) or bone. A thin line of more highly mineralized material, possibly cementum (c), separates these layers. H: The material covering root dentin is deposited in layers and sometimes fills in areas of localized root resorption.
Figure 12
Figure 12. Localization of FAM20A to the Golgi.
HEK293 cells were co-transfected with two plasmids. Cells that expressed the Golgi-GFP exhibited green fluorescence in the Golgi (A–F). FAM20A-flag was immunodetected and exhibited red fluorescence (H–J). Cells expressing both plasmids exhibited yellow fluorescence indicating superimposition of the two signals (K–M).

Similar articles

Cited by

References

    1. MacGibbon D (1972) Generalized enamel hypoplasia and renal dysfunction. Aust Dent J 17: 61–63. - PubMed
    1. Lubinsky M, Angle C, Marsh PW, Witkop CJ Jr (1985) Syndrome of amelogenesis imperfecta, nephrocalcinosis, impaired renal concentration, and possible abnormality of calcium metabolism. Am J Med Genet 20: 233–243. - PubMed
    1. Hall RK, Phakey P, Palamara J, McCredie DA (1995) Amelogenesis imperfecta and nephrocalcinosis syndrome. Case studies of clinical features and ultrastructure of tooth enamel in two siblings. Oral Surg Oral Med Oral Pathol Oral Radiol Endod 79: 583–592. - PubMed
    1. Normand de la Tranchade I, Bonarek H, Marteau JM, Boileau MJ, Nancy J (2003) Amelogenesis imperfecta and nephrocalcinosis: a new case of this rare syndrome. J Clin Pediatr Dent 27: 171–175. - PubMed
    1. Paula LM, Melo NS, Silva Guerra EN, Mestrinho DH, Acevedo AC (2005) Case report of a rare syndrome associating amelogenesis imperfecta and nephrocalcinosis in a consanguineous family. Arch Oral Biol 50: 237–242. - PubMed

Publication types

MeSH terms

Supplementary concepts