

A comparative genotoxicity study of a supraphysiological dose of triiodothyronine (T₃) in obese rats subjected to either calorie-restricted diet or hyperthyroidism
- PMID: 23468891
- PMCID: PMC3585230
- DOI: 10.1371/journal.pone.0056913
A comparative genotoxicity study of a supraphysiological dose of triiodothyronine (T₃) in obese rats subjected to either calorie-restricted diet or hyperthyroidism
Abstract
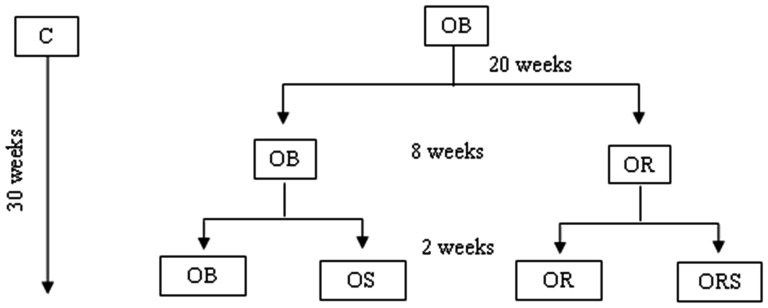
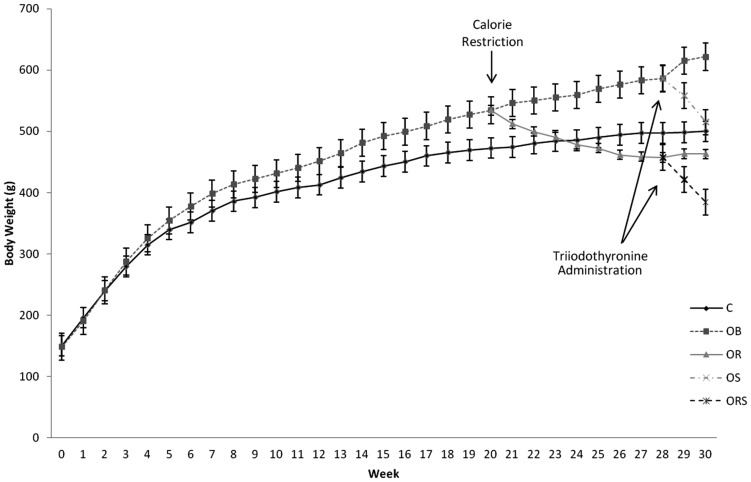
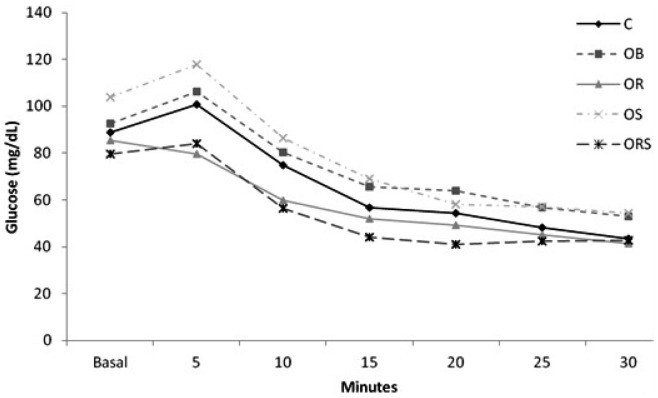
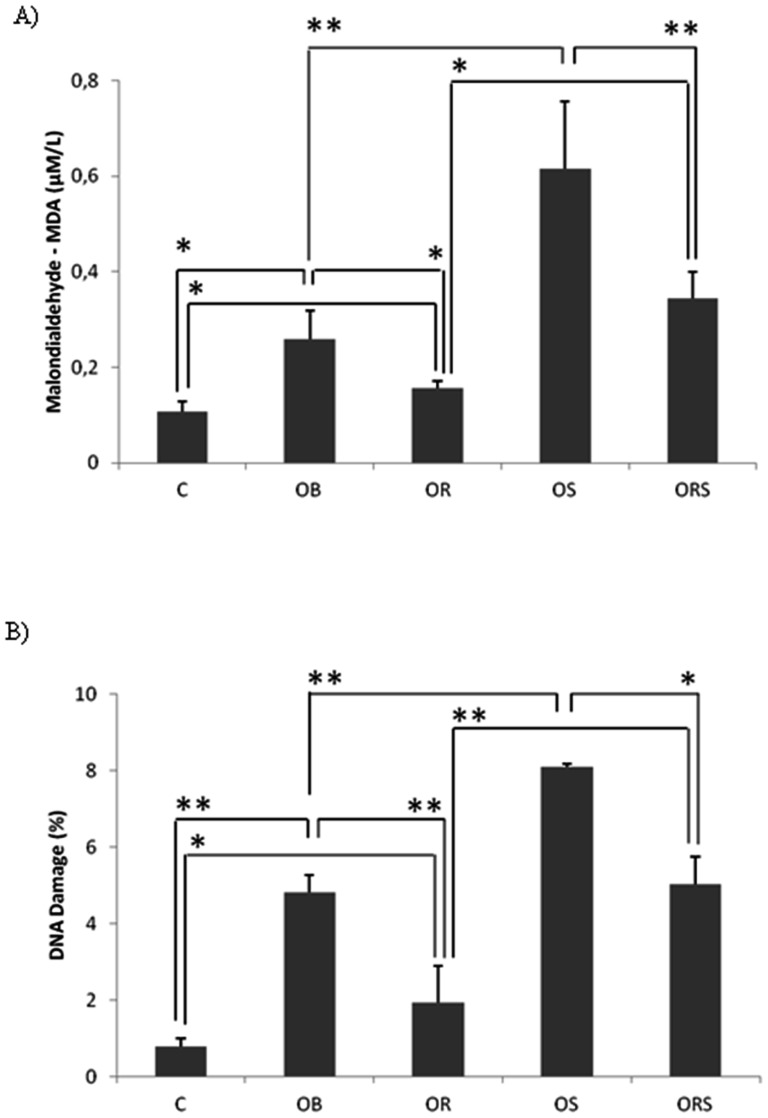
This study was designed to determine the genotoxicity of a supraphysiological dose of triiodothyronine (T3) in both obese and calorie-restricted obese animals. Fifty male Wistar rats were randomly assigned to one of the two following groups: control (C; n = 10) and obese (OB; n = 40). The C group received standard food, whereas the OB group was fed a hypercaloric diet for 20 weeks. After this period, half of the OB animals (n = 20) were subjected to a 25%-calorie restriction of standard diet for 8 weeks forming thus a new group (OR), whereas the remaining OB animals were kept on the initial hypercaloric diet. During the following two weeks, 10 OR animals continued on the calorie restriction diet, whereas the remaining 10 rats of this group formed a new group (ORS) given a supraphysiological dose of T3 (25 µg/100 g body weight) along with the calorie restriction diet. Similarly, the remaining OB animals were divided into two groups, one that continued on the hypercaloric diet (OB, n = 10), and one that received the supraphysiological dose of T3 (25 µg/100 g body weight) along with the hypercaloric diet (OS, n = 10) for two weeks. The OB group showed weight gain, increased adiposity, insulin resistance, increased leptin levels and genotoxicity; T3 administration in OS animals led to an increase in genotoxicity and oxidative stress when compared with the OB group. The OR group showed weight loss and normalized levels of adiposity, insulin resistance, serum leptin and genotoxicity, thus having features similar to those of the C group. On the other hand, the ORS group, compared to OR animals, showed higher genotoxicity. Our results indicate that regardless of diet, a supraphysiological dose of T3 causes genotoxicity and potentiates oxidative stress.
Conflict of interest statement
Figures
References
-
- O'Brien PE, Dixon JB (2002) The extent of the problem of obesity. Am J Surg 184: 4S–8S. - PubMed
-
- Astrup A, Buemann B, Western P, Toubro S, Raben A, et al. (1994) Obesity as an adaptation to a high-fat diet: evidence from a cross-sectional study. Am J Clin Nutr 59: 350–355. - PubMed
-
- Lopez-Torres M, Gredilla R, Sanz A, Barja G (2002) Influence of aging and long-term caloric restriction on oxygen radical generation and oxidative DNA damage in rat liver mitochondria. Free Radic Biol Med 32: 882–889. - PubMed
-
- Halliwell B, Gutteridge JMC (1999) Free radicals in biology and medicine. Oxford: Oxford University Press. xxxi, 936 p., [919] p. of plates p.
-
- Cowburn G, Hillsdon M, Hankey CR (1997) Obesity management by life-style strategies. Br Med Bull 53: 389–408. - PubMed
Publication types
MeSH terms
Substances
LinkOut - more resources
Full Text Sources
Other Literature Sources
Medical
Miscellaneous
