. 2013;8(2):e57462.
doi: 10.1371/journal.pone.0057462. Epub 2013 Feb 28.

Delineating the cytogenomic and epigenomic landscapes of glioma stem cell lines

Affiliations

Delineating the cytogenomic and epigenomic landscapes of glioma stem cell lines

Simona Baronchelli et al. PLoS One. 2013.

Abstract

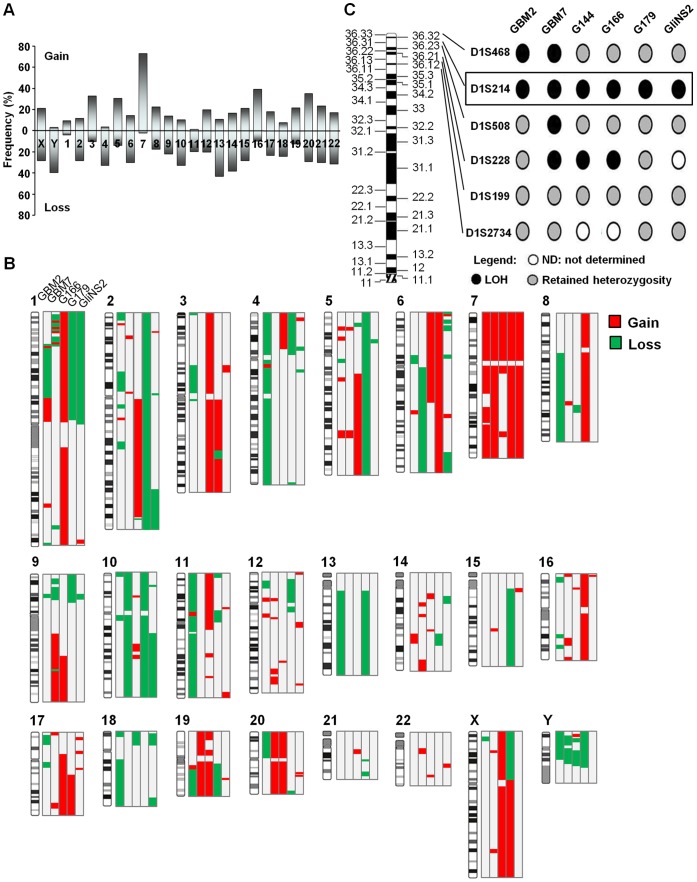
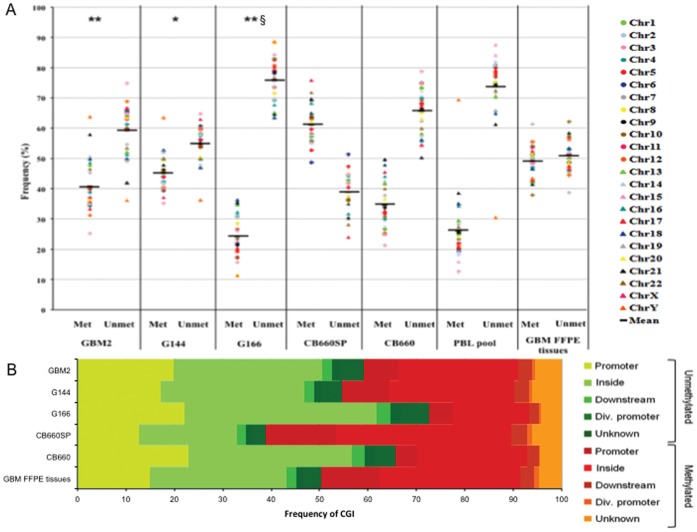
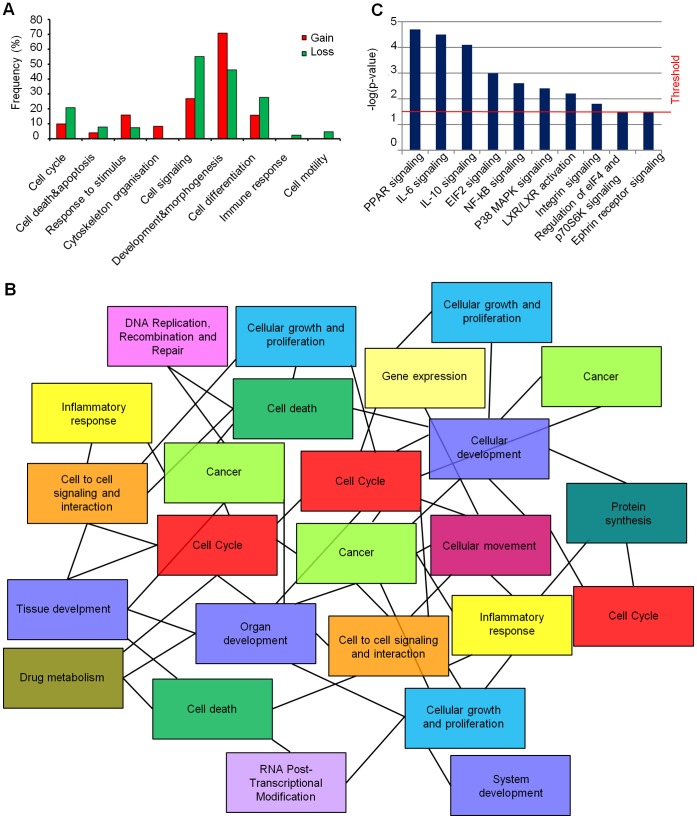
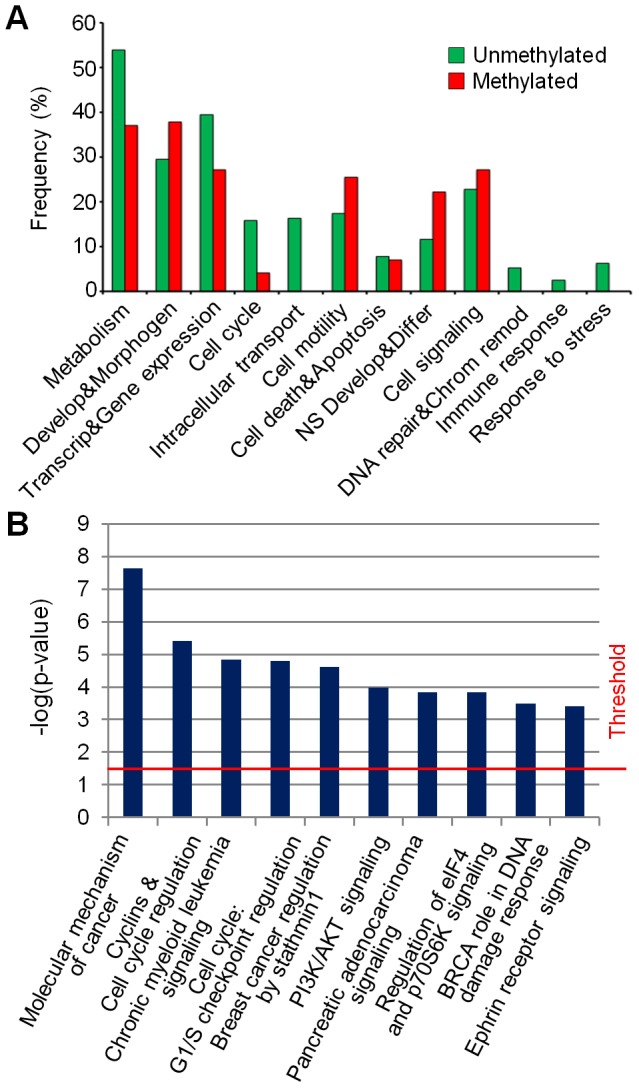
Glioblastoma multiforme (GBM), the most common and malignant type of glioma, is characterized by a poor prognosis and the lack of an effective treatment, which are due to a small sub-population of cells with stem-like properties, termed glioma stem cells (GSCs). The term "multiforme" describes the histological features of this tumor, that is, the cellular and morphological heterogeneity. At the molecular level multiple layers of alterations may reflect this heterogeneity providing together the driving force for tumor initiation and development. In order to decipher the common "signature" of the ancestral GSC population, we examined six already characterized GSC lines evaluating their cytogenomic and epigenomic profiles through a multilevel approach (conventional cytogenetic, FISH, aCGH, MeDIP-Chip and functional bioinformatic analysis). We found several canonical cytogenetic alterations associated with GBM and a common minimal deleted region (MDR) at 1p36.31, including CAMTA1 gene, a putative tumor suppressor gene, specific for the GSC population. Therefore, on one hand our data confirm a role of driver mutations for copy number alterations (CNAs) included in the GBM genomic-signature (gain of chromosome 7- EGFR gene, loss of chromosome 13- RB1 gene, loss of chromosome 10-PTEN gene); on the other, it is not obvious that the new identified CNAs are passenger mutations, as they may be necessary for tumor progression specific for the individual patient. Through our approach, we were able to demonstrate that not only individual genes into a pathway can be perturbed through multiple mechanisms and at different levels, but also that different combinations of perturbed genes can incapacitate functional modules within a cellular networks. Therefore, beyond the differences that can create apparent heterogeneity of alterations among GSC lines, there's a sort of selective force acting on them in order to converge towards the impairment of cell development and differentiation processes. This new overview could have a huge importance in therapy.


Conflict of interest statement

Competing Interests: The authors have declared that no competing interests exist.

Figures

Figure 1
Figure 1. Cytogenomic profiles of GSCs.
(A) Frequency of gains and losses of whole chromosomes in the six GSC lines analyzed by QFQ-banding. The frequencies of numerical aberrations specific for each chromosome were calculated from the total of the analyzed metaphases of the six cell lines and represented as mean values. (B) Composite array CGH profiles of GSC lines. (C) Detailed 1p LOH mapping of GSC lines. A common region of LOH was identified in all the six GSC lines, involving D1S214 microsatellite, located at 1p36.31 and highlighted by the square box.
Figure 2
Figure 2. Methylation profiles.
(A) Frequency of methylation and unmethylation of CGIs for each sample. The methylation status for each chromosome is reported and global genomic methylation percentages are displayed as the mean values of all chromosomes values. GSCs vs. CB660SP *p<0.05, **p<0.01, GSCs vs. GBM FFPE tissues §p<0.01, Chi-square test. Abbreviation: Met, methylation; Unmet, unmethylation. (B) Distribution of methylated and unmethylated CGIs among the different functional genomic regions.
Figure 3
Figure 3. GSC epigenetic signature.
Epigenetic comparison between GSC, NSC and GBM FFPE tissue methylation profiles. The inner circle shows the 378 shared methylated genes in GSC lines, while the middle circle points out 37/378 genes that were unmethylated in NSC lines. The external circle displays the methylation status in GBM FFPE tissues. Note that 10 of the 37 specifically methylated genes in the GSC lines and unmethylated in foetal NSC lines were unmethylated in GBM FFPE tissues, representing the GSC epigenetic signature. The asterisk identifies 27 “cancer de novo methylated genes” in GSC and GBM FFPE tissues vs. foetal NSCs (see also Table S9A).
Figure 4
Figure 4. Functional characterization of cytogenomic landscapes.
(A) Categories of genes determined by GO analysis and included in gain and loss regions. Each category is associated to a percentage of frequency which was calculated on the ratio between the number of genes associated to a specific category and the total number of genes associated to at least one GO term. (B) Tree topology of overlapping network established using IPA software. Genes in new “exclusive” gain and loss regions identified in GSCs profiles of aCGH were assigned to gene networks which were strictly interconnected one to each other and revealed cancer-relevant annotations. Different genes can be grouped in several networks, underlying the same mechanism (i.e. cancer or cell cycle). (C) New ‘exclusive’ CNA region-associated pathways. Each pathway is associated with a p-value (calculated by Ingenuity Pathway Analysis, IPA, software), which represents the probability that such association could have occurred by chance.
Figure 5
Figure 5. The GSCs’ methylation profiles evidence the functional impairment of cell development and differentiation processes.
(A) Functional annotation analysis of commonly methylated or unmethylated gene promoters in all the three GSC lines (GBM2, G144 and G166), performed using GOstat software. The graph shows the percentage (y-axis) of each category compared to totally annotated genes. (B) Top 10 pathways influenced by DNA methylation pattern in GSCs. A p-value (calculated by the Ingenuity Pathway Analysis, IPA, software) is associated to each pathway; this value represents the probability that such association could have occurred by chance.

References

    1. Louis DN, Ohgaki H, Wiestler OD, Cavenee WK, Burger PC, et al. (2007) The 2007 WHO classification of tumours of the central nervous system. Acta Neuropathol 114: 97–109. - PMC - PubMed
    1. Hegi ME, Janzer RC, Lambiv WL, Gorlia T, Kouwenhoven MC, et al. (2012) Presence of an oligodendroglioma-like component in newly diagnosed glioblastoma identifies a pathogenetically heterogeneous subgroup and lacks prognostic value: central pathology review of the EORTC_26981/NCIC_CE.3 trial. Acta Neuropathol 123: 841–852. - PubMed
    1. Gorlia T, Stupp R, Brandes AA, Rampling RR, Fumoleau P, et al. (2012) New prognostic factors and calculators for outcome prediction in patients with recurrent glioblastoma: a pooled analysis of EORTC Brain Tumour Group phase I and II clinical trials. Eur J Cancer 48: 1176–1184. - PubMed
    1. Stupp R, Mason WP, van den Bent MJ, Weller M, Fisher B, et al. (2005) Radiotherapy plus concomitant and adjuvant temozolomide for glioblastoma. N Engl J Med 352: 987–996. - PubMed
    1. Wen PY, Kesari S (2008) Malignant gliomas in adults. N Engl J Med 359: 492–507. - PubMed

Publication types