

Pollen lipidomics: lipid profiling exposes a notable diversity in 22 allergenic pollen and potential biomarkers of the allergic immune response
- PMID: 23469025
- PMCID: PMC3585183
- DOI: 10.1371/journal.pone.0057566
Pollen lipidomics: lipid profiling exposes a notable diversity in 22 allergenic pollen and potential biomarkers of the allergic immune response
Abstract
Background/aim: Pollen grains are the male gametophytes that deliver sperm cells to female gametophytes during sexual reproduction of higher plants. Pollen is a major source of aeroallergens and environmental antigens. The pollen coat harbors a plethora of lipids that are required for pollen hydration, germination, and penetration of the stigma by pollen tubes. In addition to proteins, pollen displays a wide array of lipids that interact with the human immune system. Prior searches for pollen allergens have focused on the identification of intracellular allergenic proteins, but have largely overlooked much of the extracellular pollen matrix, a region where the majority of lipid molecules reside. Lipid antigens have attracted attention for their potent immunoregulatory effects. By being in close proximity to allergenic proteins on the pollen surface when they interact with host cells, lipids could modify the antigenic properties of proteins.
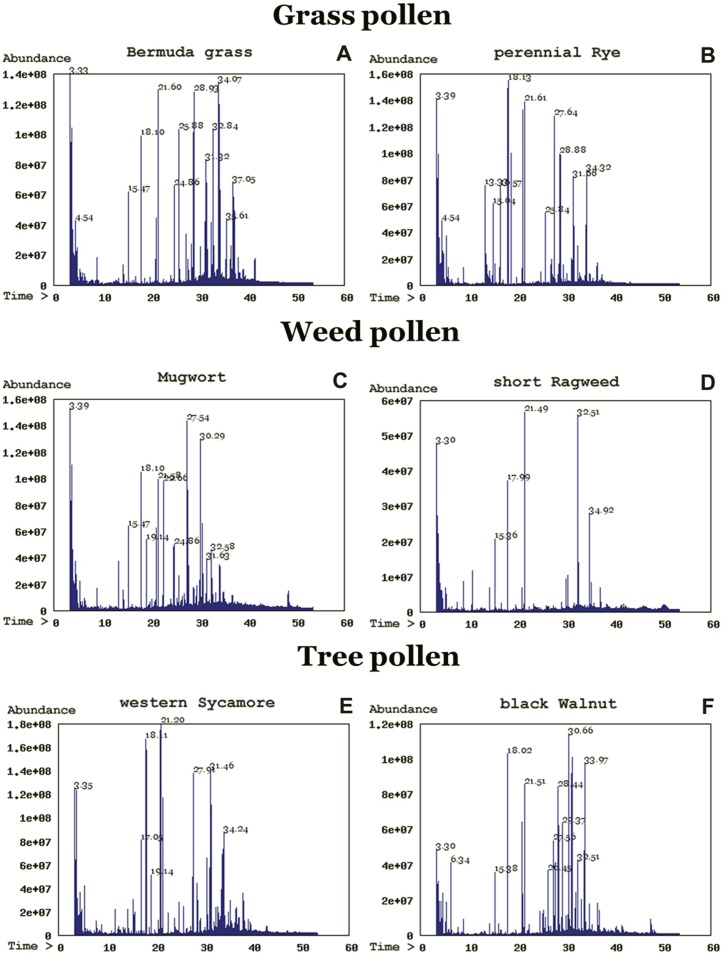
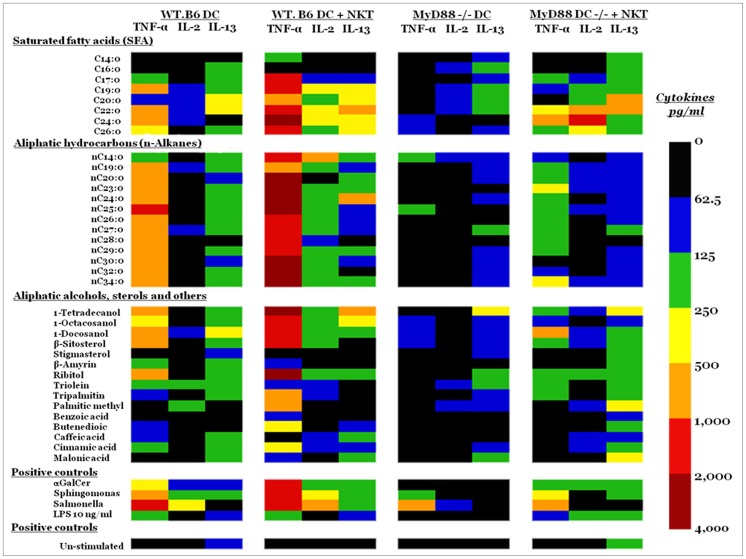
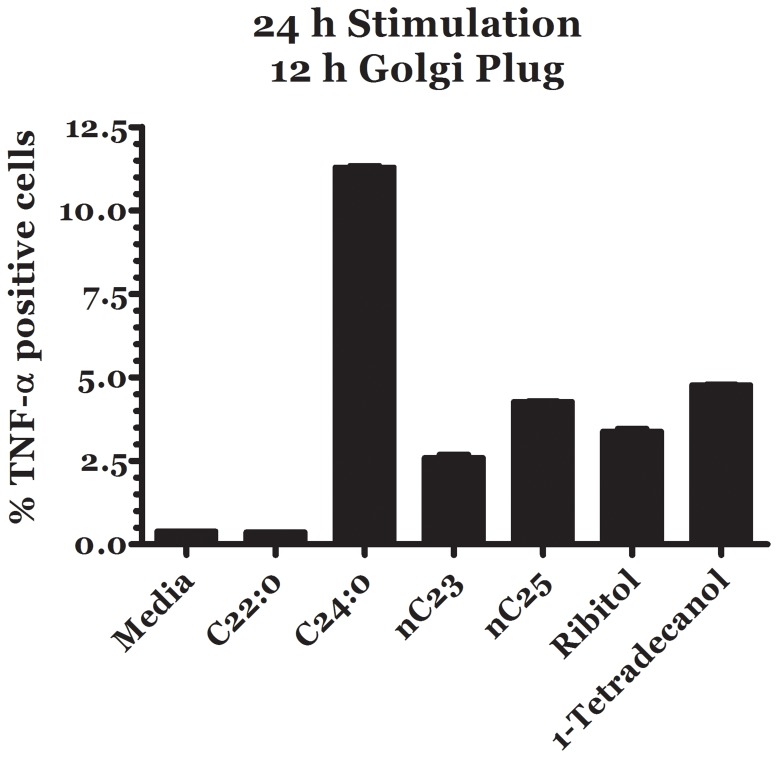
Methodology/principal findings: We performed a comparative pollen lipid profiling of 22 commonly allergenic plant species by the use of gas chromatography-mass spectroscopy, followed by detailed data mining and statistical analysis. Three experiments compared pollen lipid profiles. We built a database library of the pollen lipids by matching acquired pollen-lipid mass spectra and retention times with the NIST/EPA/NIH mass-spectral library. We detected, identified, and relatively quantified more than 106 lipid molecular species including fatty acids, n-alkanes, fatty alcohols, and sterols. Pollen-derived lipids stimulation up-regulate cytokines expression of dendritic and natural killer T cells co-culture.
Conclusions/significance: Here we report on a lipidomic analysis of pollen lipids that can serve as a database for identifying potential lipid antigens and/or novel candidate molecules involved in allergy. The database provides a resource that facilitates studies on the role of lipids in the immunopathogenesis of allergy. Pollen lipids vary greatly among allergenic species and contain many molecules that have stimulatory or regulatory effects on immune responses.
Conflict of interest statement
Figures
References
-
- Nathan RA (2007) The burden of allergic rhinitis. Allergy Asthma Proc 28: 3–9. - PubMed
-
- Wolters-Arts M, Lush WM, Mariani C (1998) Lipids are required for directional pollen-tube growth. Nature 392: 818–821. - PubMed
-
- Piffanelli P, Ross JH, Murphy DJ (1997) Intra- and extracellular lipid composition and associated gene expression patterns during pollen development in Brassica napus. Plant J 11: 549–562. - PubMed
-
- Preuss D, Lemieux B, Yen G, Davis RW (1993) A conditional sterile mutation eliminates surface components from Arabidopsis pollen and disrupts cell signaling during fertilization. Genes Dev 7: 974–985. - PubMed
-
- Dickinson H (1993) Pollen dressed for success. Nature 364: 573–574.
Publication types
MeSH terms
Substances
LinkOut - more resources
Full Text Sources
Other Literature Sources
Medical
Research Materials
