. 2013;8(2):e57953.
doi: 10.1371/journal.pone.0057953. Epub 2013 Feb 26.

Spatiotemporal dynamics of early DNA damage response proteins on complex DNA lesions

Affiliations

Spatiotemporal dynamics of early DNA damage response proteins on complex DNA lesions

Frank Tobias et al. PLoS One. 2013.

Abstract

The response of cells to ionizing radiation-induced DNA double-strand breaks (DSB) is determined by the activation of multiple pathways aimed at repairing the injury and maintaining genomic integrity. Densely ionizing radiation induces complex damage consisting of different types of DNA lesions in close proximity that are difficult to repair and may promote carcinogenesis. Little is known about the dynamic behavior of repair proteins on complex lesions. In this study we use live-cell imaging for the spatio-temporal characterization of early protein interactions at damage sites of increasing complexity. Beamline microscopy was used to image living cells expressing fluorescently-tagged proteins during and immediately after charged particle irradiation to reveal protein accumulation at damaged sites in real time. Information on the mobility and binding rates of the recruited proteins was obtained from fluorescence recovery after photobleaching (FRAP). Recruitment of the DNA damage sensor protein NBS1 accelerates with increasing lesion density and saturates at very high damage levels. FRAP measurements revealed two different binding modalities of NBS1 to damage sites and a direct impact of lesion complexity on the binding. Faster recruitment with increasing lesion complexity was also observed for the mediator MDC1, but mobility was limited at very high damage densities due to nuclear-wide binding. We constructed a minimal computer model of the initial response to DSB based on known protein interactions only. By fitting all measured data using the same set of parameters, we can reproduce the experimentally characterized steps of the DNA damage response over a wide range of damage densities. The model suggests that the influence of increasing lesion density accelerating NBS1 recruitment is only dependent on the different binding modes of NBS1, directly to DSB and to the surrounding chromatin via MDC1. This elucidates an impact of damage clustering on repair without the need of invoking extra processing steps.


Conflict of interest statement

Competing Interests: The authors have declared that no competing interests exist.

Figures

Figure 1
Figure 1. Beamline microscopy of U2OS cells expressing NBS1-GFP.
Cells were irradiated with Sm ions (LET 10290 keV/µm) at 0 s generating DNA damage along their trajectory. These damaged sites are detected by the repair protein NBS1 and the amount of accumulated protein increases with time. This causes the formation of clearly visible foci and a rise in the fluorescent signal over time. Only selected time-points are shown.
Figure 2
Figure 2. NBS1 protein accumulation at DSBs after ion irradiation.
A: Normalized protein accumulation of NBS1 at DNA damage sites after C and V ion irradiation. When very high damage densities are created after exposure to a higher linear energy transfer (LET) radiation, NBS1 accumulates faster and saturates after shorter time. Error bars are 95% confidence interval. B: Monoexponential time constant, representing the time when 63% of the final foci intensity is reached (green lines in A), for NBS1 recruitment plotted as a function of the LET. Each LET value corresponds to one ion species. With increasing LET, the NBS1 accumulation accelerates up to about 3000 keV/µm and remains constant at further increasing ionization densities. Time constants of Rad50 and MRE11 accumulation are shown in red and blue respectively. Error bars are 95% confidence interval.
Figure 3
Figure 3. MDC1 protein accumulation at ion tracks.
A: Normalized MDC1 protein recruitment to DNA damage sites after C- and Au-particle irradiation. Like NBS1, MDC1 accumulates faster at very high damage densities. Error bars are 95 % confidence interval. B: Monoexponential time constant, representing the time when 63% of the final foci intensity is reached (green lines in A), for MDC1 accumulation plotted as function of the LET. MDC1 protein accumulation accelerates with increasing LET, but saturates at higher LET values above 9000 keV/µm. Error bars are 95% confidence interval.
Figure 4
Figure 4. Repair protein mobility in untreated cells.
A: FRAP curves of GFP-tagged NBS1 and MDC1 in untreated U2OS cells. Error bars are standard deviation. B: Enlarged section from A from 0 s to 70 s. Effective diffusion fits are shown in red. Error bars are standard deviation.
Figure 5
Figure 5. FRAP measurement of repair proteins bound at damaged DNA.
U2OS cells expressing NBS1-GFP were irradiated with Ti ions (LET ∼270 keV/µm) under a low angle resulting in a streak-shaped foci pattern along the ion trajectory (red arrow). At time 0 s the fluorescence tag of the proteins in a small part of the streak are bleached with a short and intense laser pulse (cyan arrow). Fluorescence recovery in the bleached region represents the protein exchange at the DNA damage. Selected time frames are shown. Time labels correspond to the time after bleaching.
Figure 6
Figure 6. FRAP measurements of NBS1 binding on damaged DNA after irradiation with ions of different LETs.
NBS1 proteins bound to damaged DNA showed a reduced mobility compared to unbound proteins. For times beyond ∼10 s the FRAP curves showed a shallower increase with increasing LET. Error bars are not shown for the sake of clarity. Exemplary error bars are included in Figure 4 and Figure 7, the others are comparable.
Figure 7
Figure 7. NBS1 binding at damaged DNA following CK2 inhibition.
NBS1 binding at damaged DNA after CK2 inhibition preventing the interaction between NBS1 and MDC1. Cells were irradiated with Ar-ions. Error bars are standard deviation.
Figure 8
Figure 8. Influence of LET and CK2 inhibition on NBS1 binding to IRIF.
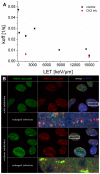
A) NBS1 dissociation constant koff versus the LET. Values were obtained by fitting the FRAP curves with the diffusion reaction model described by Sprague and coworkers . As the LET increases, protein binding constants approach the values of NBS1 binding obtained with CK2 inhibition. Error bars correspond to the asymptotic standard error. B) Influence of CK2 inhibition on NBS1 and MDC1 foci size. Immunofluorescence staining of NBS1 and MDC1 after Au ion irradiation with and without CK2-inhibition. U2OS cells were fixed 10 min after Au ion irradiation and immunocytochemically stained against NBS1 (green) and MDC1 (red). DNA was counterstained with DAPI (blue). Scalebar 10 µm.
Figure 9
Figure 9. FRAP curves of MDC1 binding after charged particle irradiation.
The mobility of MDC1 is drastically reduced at damaged DNA. MDC1 mobility is not only reduced at damaged sites but also in the whole nucleus when very high damaged densities are generated after heavy charged particle irradiation. Error bars are 95% confidence interval.
Figure 10
Figure 10. Schematic of interactions in our minimal model. MRN binds directly to the DSB strand ends.
ATM is activated there and subsequently phosphorylates H2AX. MDC1 must be recruited to γH2AX before MRN can bind in the outer focus. In a final step, ATM also binds to recruited MDC1. For clarity, only the nucleosomes that contain H2AX are depicted.
Figure 11
Figure 11. Comparison of NBS1 and ATM recruitment data with model results.
A–C: NBS1 data and NBS1 signal calculated from the recruitment model for LETs of 170 keV/µm, 3590 keV/µm and 10290 keV/µm. Dashed lines indicate the NBS1 signal contribution of MRN recruited to the inner focus (MRN_i), whereas solid lines indicate total recruited NBS1 signal. D: ATM recruitment data and model for an LET of 14350 keV/µm. Dashed line indicates ATM bound at the inner focus, solid line indicates total recruited ATM. The concentration of H2AX in the focus, which limits binding sites for MRN and ATM in the outer focus, has a value of 3500. Additional figures for all of our recruitment data can be found in the supplementary material.
Figure 12
Figure 12. Active ATM in the model and comparison MDC1 model/experiment.
A: Activation of ATM in the model for an LET of 170 keV/µm and of 14350 keV/µm. The high LET curve goes into saturation as all of the available ATM is activated. It has to be noted that the absolute maximum value for ATM is a relative value that represents the effective concentration of ATM (due to its fast diffusion throughout the nucleus). B: MDC1 data set for an LET of 200 keV/µm and the corresponding simulation results (solid curve). In this particular calculation the steady state concentrations for MDC1 are not reached in the first 700 s. For larger times, the total number of recruited MDC1 saturates at a value of 3500. The fit at low LET can be considerably improved by taking into account the slow diffusion of MDC1. When the amount of available MDC1 in the simulation is made to increase as (4Dt)1/2, as would be the case for diffusion in a cylindrical geometry, the dashed curve is obtained.

References

    1. Stracker TH, Petrini JHJ (2011) The MRE11 complex: starting from the ends. Nature Reviews Molecular Cell Biology 12: 90–103. - PMC - PubMed
    1. Christmann M, Tomicic MT, Roos WP, Kaina B (2003) Mechanisms of human dna repair: an update. Toxicology 193: 3–34. - PubMed
    1. Difilippantonio S, Nussenzweig A (2007) The nbs1-atm connection revisited. Cell Cycle (Georgetown, Tex) 6: 2366–2370. - PubMed
    1. Petrini JHJ, Stracker TH (2003) The cellular response to dna double-strand breaks: defining the sensors and mediators. Trends in Cell Biology 13: 458–462. - PubMed
    1. Hopfner KP, Craig L, Moncalian G, Zinkel RA, Usui T, et al. (2002) The rad50 zinc-hook is a structure joining mre11 complexes in dna recombination and repair. Nature 418: 562–566. - PubMed

Publication types