. 2013;7(2):e2060.
doi: 10.1371/journal.pntd.0002060. Epub 2013 Feb 28.

Differential expression of Toll-like receptors in dendritic cells of patients with dengue during early and late acute phases of the disease

Affiliations

Differential expression of Toll-like receptors in dendritic cells of patients with dengue during early and late acute phases of the disease

Silvia Torres et al. PLoS Negl Trop Dis. 2013.

Abstract

Background: Dengue hemorrhagic fever (DHF) is observed in individuals that have pre-existing heterotypic dengue antibodies and is associated with increased viral load and high levels of pro-inflammatory cytokines early in infection. Interestingly, a recent study showed that dengue virus infection in the presence of antibodies resulted in poor stimulation of Toll-like receptors (TLRs), thereby facilitating virus particle production, and also suggesting that TLRs may contribute to disease pathogenesis.

Methodology/principal findings: We evaluated the expression levels of TLR2, 3, 4 and 9 and the co-stimulatory molecules CD80 and CD86 by flow cytometry. This was evaluated in monocytes, in myeloid and plasmacytoid dendritic cells (mDCs and pDCs) from 30 dengue patients with different clinical outcomes and in 20 healthy controls. Increased expression of TLR3 and TLR9 in DCs of patients with dengue fever (DF) early in infection was detected. In DCs from patients with severe manifestations, poor stimulation of TLR3 and TLR9 was observed. In addition, we found a lower expression of TLR2 in patients with DF compared to DHF. Expression levels of TLR4 were not affected. Furthermore, the expression of CD80 and CD86 was altered in mDCs and CD86 in pDCs of severe dengue cases. We show that interferon alpha production decreased in the presence of dengue virus after stimulation of PBMCs with the TLR9 agonist (CpG A). This suggests that the virus can affect the interferon response through this signaling pathway.

Conclusions/significance: These results show that during dengue disease progression, the expression profile of TLRs changes depending on the severity of the disease. Changes in TLRs expression could play a central role in DC activation, thereby influencing the innate immune response.


Conflict of interest statement

The authors declare that they have no conflict of interests.

Figures

Figure 1
Figure 1. Flowchart of enrolment, inclusion/exclusion criteria, diagnosis and classification of dengue patients.
Figure 2
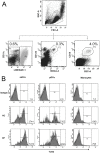
Figure 2. Gating strategy for identification of mDCs, pDCs and monocytes from PB samples and TLR staining.
(A) Non duplets population was fractioned in mDCs as mononuclear cells Lin and CD11c High (P3); (pDCs) as CD123+ BDCA2+ (P2) and monocytes as CD14+ (P2) . (B) Representative examples of TLR2 expression in mDCs, pDCs, and monocytes. HC indicates healthy control and DF denotes for dengue fever.
Figure 3
Figure 3. Increased expression of TLRs in mDCs and pDCs of dengue-infected patients.
Expression profile of TLR2, 3, 4 and 9 in mDCs (A) and pDCs (B) of dengue patients isolated at different times after the onset of disease symptoms (day 3, 5 and 15) (n = 30) and of healthy controls (n = 20). The evaluation of TLR expression was performed by flow cytometry based on mean fluorescence intensity (MFI) analysis. Data are presented as the median and 25–75 interquartile ranges Statistical analysis was performed by using the Kruskal-Wallis test followed by the Dunn's Multiple comparisons Test. *p<0.05, ** p<0.01 and ***p<0.001.
Figure 4
Figure 4. Increased TLR2 expression in pDCs of patients with severe disease.
Analysis of TLR2 expression by flow cytometry of PB mDCs (A) and pDCs (B) in DF patients (n = 19) and DHF patients (n = 11) at different times after the onset of symptoms (days 3, 5 and 15). Data are presented as the median and 25–75 interquartile ranges. Statistical analysis was performed by the Mann Withney test.*p<0.05, ** p<0.01 and ***p<0.001.
Figure 5
Figure 5. TLR3 and TLR9 in mDCs and TLR9 in pDCs have different expression levels depending on disease severity.
Expression profile of TLR2 and TLR9 in mDCs (A and B) and pDCs (C) of dengue patients isolated at different times after the onset of disease symptoms (day 3, 5 and 15) (n = 30) and of healthy controls (n = 20). The evaluation of TLR expression was performed by flow cytometry based on mean fluorescence intensity (MFI) analysis. Data are presented as the median and 25–75 interquartile ranges Statistical analysis was performed by using the Kruskal-Wallis test followed by the Dunn's Multiple comparisons Test. *p<0.05, ** p<0.01 and ***p<0.001.
Figure 6
Figure 6. Expression of the co-stimulatory molecules CD80 and CD86 is affected in mDCs of DHF patients.
Expression of CD80 (A) and CD86 (B) was evaluated by flow cytometry based on the FMI analysis in mDCs and pDCs (C) of DF and DHF patients on day 3 of illness and compared to that of healthy controls (HC). Data are presented as the median and the statistical analysis of the expression of CD80 and CD86 was performed by the Mann Withney test.*p<0.05, ** p<0.01 and ***p<0.001.
Figure 7
Figure 7. IFN-α production by PBMCs in response to TLR9 ligand is impaired by DENV infection.
PBMCs from healthy controls were challenge with wild type DENV or iDENV at a MOI of 5 and then stimulated with agonists for TLR3 (poly∶IC), TLR4 (LPS), TLR7 and TLR8 (R848) and TLR9 (CpG A). The production of IFN-α was measured by ELISA a 24 h post-stimulation. The antagonist of TLR9 (TTAGGG ODN) was used to neutralize the stimulatory effect of GpG A. The supernatant from C6/36 cells were used as mock and Influenza virus was used as a positive control for IFN-α production.. Data are presented as the mean of values of at least two independent experiments performed in triplicate; error bars indicate standard deviation. Statistical comparisons among groups were carried out using the Kruskal-Wallis test comparing between groups. *p<0.05 and** p<0.01.

References

    1. WHO (2009) Dengue and Dengue Hemorrhagic Fever. World Health Organization.
    1. Lindenbach BD, Rice CM (2003) Molecular biology of flaviviruses. Adv Virus Res 59: 23–61. - PubMed
    1. WHO (1997) Dengue Hemorrhagic fever: Diagnosis, treatment, prevention and control. World Health Organization.
    1. Halstead SB, Nimmannitya S, Cohen SN (1970) Observations related to pathogenesis of dengue hemorrhagic fever IV. Relation of disease severity to antibody response and virus recovered. Yale J Biol MEd 42: 311–328. - PMC - PubMed
    1. de Kruif MD, Setiati TE, Mairuhu AT, Koraka P, Aberson HA, et al. (2008) Differential gene expression changes in children with severe dengue virus infections. PLoS Negl Trop Dis 2: e215. - PMC - PubMed

Publication types