. 2013 Apr 2;85(7):3698-706.
doi: 10.1021/ac4000514. Epub 2013 Mar 20.

Single nanoparticle detection for multiplexed protein diagnostics with attomolar sensitivity in serum and unprocessed whole blood

Affiliations

Single nanoparticle detection for multiplexed protein diagnostics with attomolar sensitivity in serum and unprocessed whole blood

Margo R Monroe et al. Anal Chem. .

Abstract

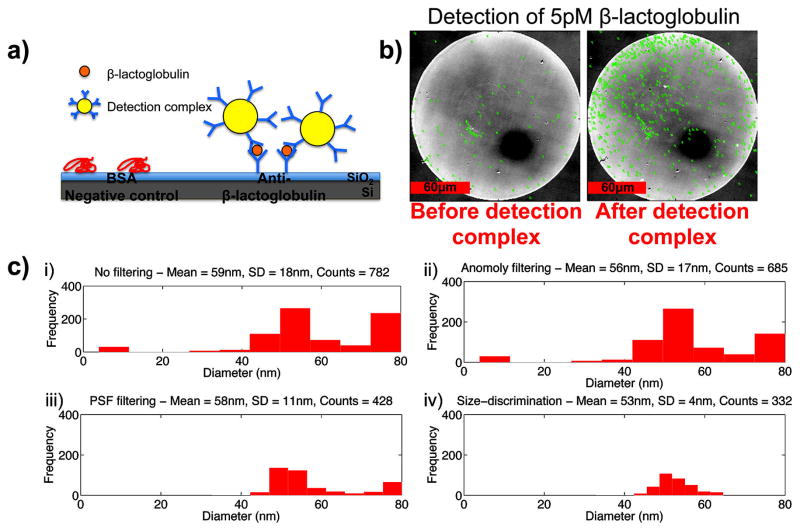
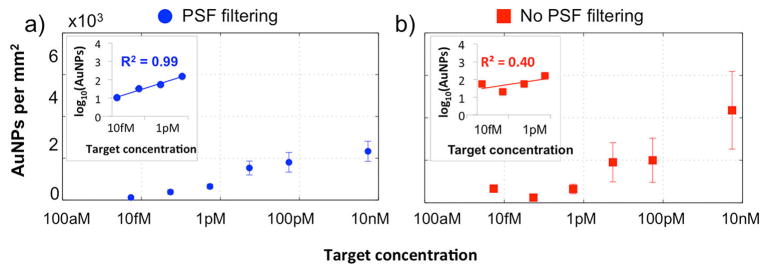
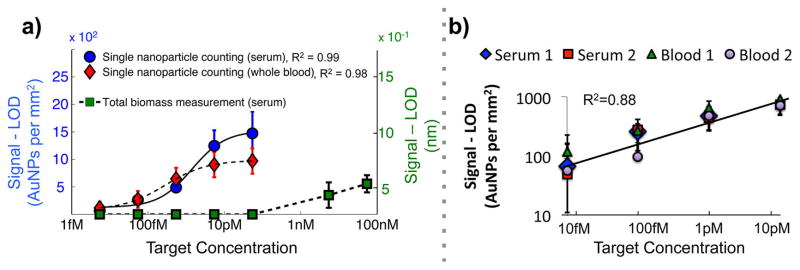
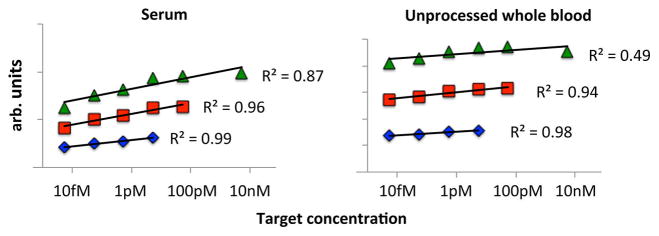
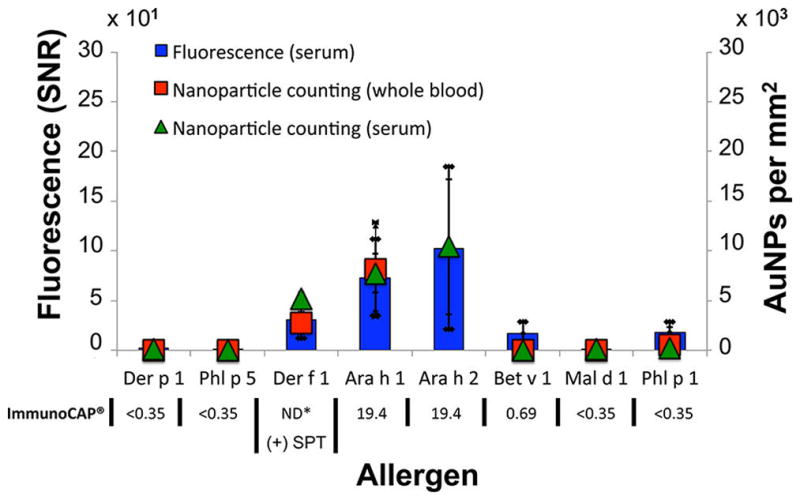
Although biomarkers exist for a range of disease diagnostics, a single low-cost platform exhibiting the required sensitivity, a large dynamic-range and multiplexing capability, and zero sample preparation remains in high demand for a variety of clinical applications. The Interferometric Reflectance Imaging Sensor (IRIS) was utilized to digitally detect and size single gold nanoparticles to identify protein biomarkers in unprocessed serum and blood samples. IRIS is a simple, inexpensive, multiplexed, high-throughput, and label-free optical biosensor that was originally used to quantify biomass captured on a surface with moderate sensitivity. Here we demonstrate detection of β-lactoglobulin, a cow's milk whey protein spiked in serum (>10 orders of magnitude) and whole blood (>5 orders of magnitude), at attomolar sensitivity. The clinical utility of IRIS was demonstrated by detecting allergen-specific IgE from microliters of characterized human serum and unprocessed whole blood samples by using secondary antibodies against human IgE labeled with 40 nm gold nanoparticles. To the best of our knowledge, this level of sensitivity over a large dynamic range has not been previously demonstrated. IRIS offers four main advantages compared to existing technologies: it (i) detects proteins from attomolar to nanomolar concentrations in unprocessed biological samples, (ii) unambiguously discriminates nanoparticles tags on a robust and physically large sensor area, (iii) detects protein targets with conjugated very small nanoparticle tags (~40 nm diameter), which minimally affect assay kinetics compared to conventional microparticle tagging methods, and (iv) utilizes components that make the instrument inexpensive, robust, and portable. These features make IRIS an ideal candidate for clinical and diagnostic applications.


Conflict of interest statement

The authors declare no competing financial interest.

Figures

Figure 1
Figure 1
(a) Detection schematic of β-lactoglobulin using anti-β-lactoglobulin functionalized 40 nm AuNPs as the detection complex. The mean final diameter of the detection complex after functionalization was measured to be 51 nm with dynamic light scattering (DLS). BSA was used as a negative control. (b) IRIS images before and after detection of complex incubation to detect 5 pM of β-lactoglobulin spiked in unprocessed whole blood. (c) Histograms of detected particles on the sensor area of anti-β-lactoglobulin probes and the mean, standard deviation (SD) and counts using (i) no filtering, (ii) anomaly filtering, (iii) point spread function (PSF) filtering, and (iv) size discrimination. The size and distribution of the functionalized AuNP diameters agree with the sizes measured by DLS and the distribution specifications provided by the distributor.
Figure 2
Figure 2
Insets are the log–log plot of each measurement and display the effects of point-spread function (PSF) filtering on the correlation of the signal to target concentration in undiluted serum. Without PSF filtering, the sensitivity drops from the attomolar to picomolar regime and the dynamic range decreases by 4 logs of magnitude. Standard deviation from the mean also increases without PSF filtering because particulates in the image were falsely detected as gold particles. Finally, correlation of AuNPs per square millimeter to dilution is reduced from 0.99 to 0.40 without implementing PSF filtering.
Figure 3
Figure 3
(a) The response determined by the signal minus the limit of detection of either IRIS nanoparticle counting or total biomass measurement. Results demonstrate comparable responses of target detection by nanoparticle counting in serum (N = 8) and whole blood (N = 4). Correlation was determined by taking the power-log of the response and target concentration of single nanoparticle data (Rserum2 = 0.99, Rwhole-blood2=0.98). When the nanoparticle counting measurement reaches its upper limit, the total biomass measurement becomes sensitive. Error bars refer to the standard deviation of the mean. (b) The response determined by the signal minus the limit of detection (LOD) for two serums and two whole bloods experiments. The correlation between the mean of each data point (16 total points from 4 experiments) is 0.88. Error bars correspond to the standard deviation between the mean (Nserum = 8, Nblood = 4).
Figure 4
Figure 4
The limit of detection (LOD) per square millimeter as a function of sensor size for serum and whole blood. At a sensor area of 0.684 mm2 (8 spots of immobilized probe), the LOD is 62 aM for serum and 507 aM in whole blood.
Figure 5
Figure 5
The upper limit of quantitation (ULQ), defined at where the linear correlation between signal and concentration becomes less than R2 = 0.90, was determined to be 100 pM for both serum and unprocessed whole blood samples. The y axis values are the log of the signal (AuNPs per square millimeter) at each concentration and scaled to see each individual regression line.
Figure 6
Figure 6
Multiplexed assay to detect specific IgE to eight allergens. Fluorescence measurement was used as a control to validate nanoparticle counting detection (R2 = 0.97 for serum both and whole blood samples). Human sample was characterized with Phadia ImmunoCAP or skin prick testing (SPT): (+) reflects a positive result. Error bars correspond to the standard deviation from the mean (n = 4). The * indicates that the results were not determined.

References

    1. Gubala V, Harris L, Ricco A, Tan M, Williams D. Anal Chem. 2012;84:487–515. - PubMed
    1. Jemal A, Clegg LX, Ward E, Ries LA, Wu X, Jamison PM, Wingo PA, Howe HL, Anderson RN, Edwards BK. Cancer. 2004;101:27.
    1. Gruchalla RS, Pongracic J, Plaut M, Evans R, Visness CM, Walter M, Crain EF, Kattan M, Morgan WJ, Steinbach S, Stout J, Malindzak G, Smartt E, Mitchell H. J Allergy Clin Immunol. 2005;115:478–485. - PubMed
    1. Morgan WJ, Crain EF, Gruchalla RS, O’Connor GT, Kattan M, Evans RI, Stout J, Malindzak G, Smartt E, Plaut M, Walter M, Vaughn B, Mitchell H, Grp ICAS. N Engl J Med. 2004;351:1068–1080. - PubMed
    1. Rusling J, Kumar C, Gutkind J, Patel V. Analyst. 2010;135:2496–2511. - PMC - PubMed

Publication types