. 2013 Apr 2;108(6):1358-67.
doi: 10.1038/bjc.2013.92. Epub 2013 Mar 7.

Semiautomated isolation and molecular characterisation of single or highly purified tumour cells from CellSearch enriched blood samples using dielectrophoretic cell sorting

Affiliations

Semiautomated isolation and molecular characterisation of single or highly purified tumour cells from CellSearch enriched blood samples using dielectrophoretic cell sorting

D J E Peeters et al. Br J Cancer. .

Abstract

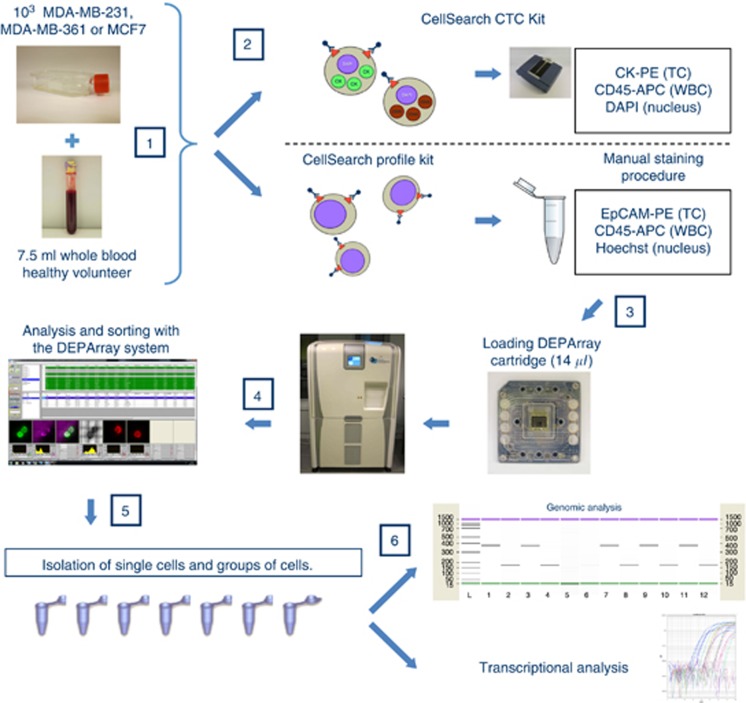
Background: Molecular characterisation of single circulating tumour cells (CTCs) holds considerable promise for predictive biomarker assessment and to explore CTC heterogeneity. We evaluate a new method, the DEPArray system, that allows the dielectrophoretic manipulation and isolation of single and 100% purified groups of CTCs from pre-enriched blood samples and explore the feasibility of their molecular characterisation.

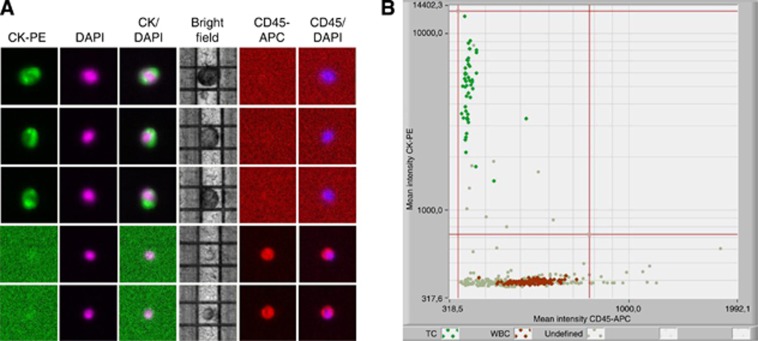
Methods: Samples containing known numbers of two cell populations were used to assess cell loss during sample loading. Cultured breast cancer cells were isolated from spiked blood samples using CellSearch CTC and Profile kits. Single tumour cells and groups of up to 10 tumour cells were recovered with the DEPArray system and subjected to transcriptional and mutation analysis.

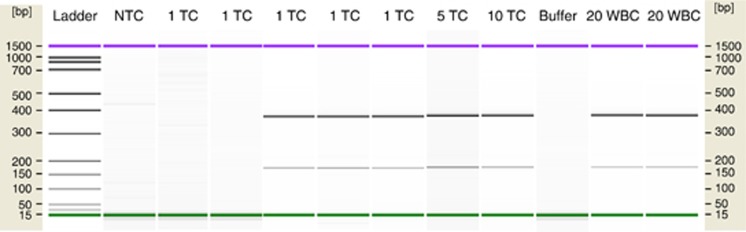
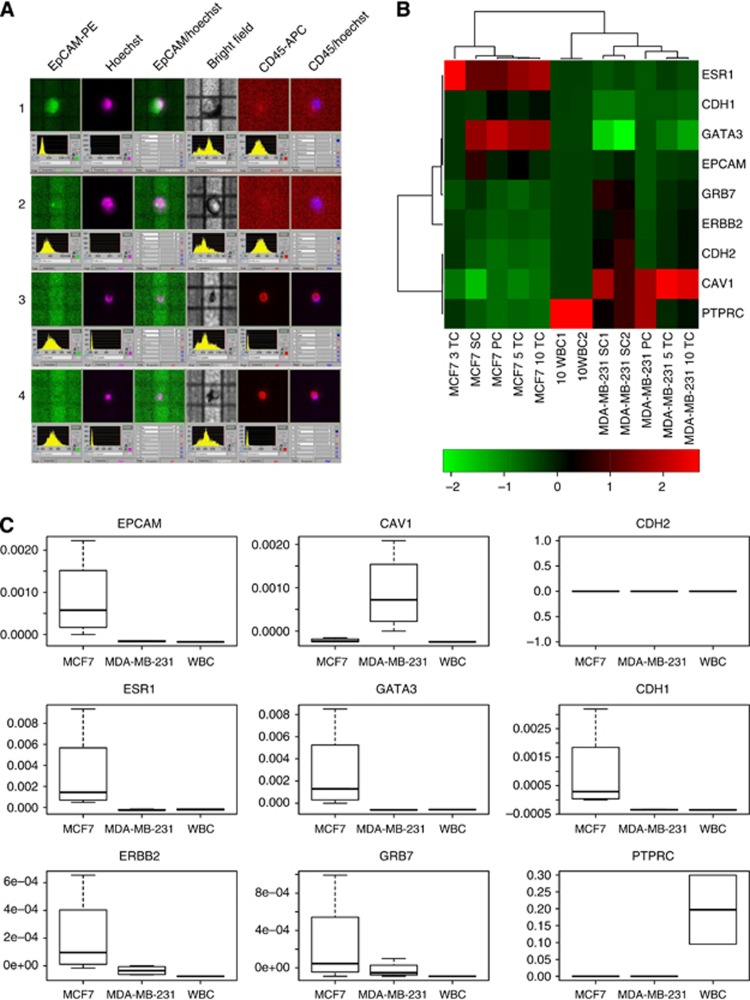
Results: On average, 40% cell loss was observed when loading samples to the DEPArray system. Expected mutations in clinically relevant markers could be obtained for 60% of single recovered tumour cells and all groups of tumour cells. Reliable gene expression profiles were obtained from single cells and groups of up to 10 cells for 2 out of 3 spiked breast cancer cell lines.

Conclusion: We describe a semiautomated workflow for the isolation of small groups of 1 to 10 tumour cells from whole blood samples and provide proof of principle for the feasibility of their comprehensive molecular characterisation.


Figures

Figure 1
Figure 1
Schematic of overall experimental workflow. Step 1: Tumour cells of three different human cultured breast cancer cell lines were spiked in healthy donor blood at a concentration of 103 tumour cells per 7.5 ml whole blood. Step 2: Tumour cells were immunomagnetically enriched using either the CellSearch CTC kit or the CellSearch Profile kit followed by a manual staining procedure. Step 3: Cells were reconstituted in a final volume of 14 μl and loaded in a DEPArray cartridge. Step 4: Analysis and sorting procedures were performed on the DEPArray system. Step 5: Single cells and groups of cells of interest were isolated with the DEPArray system. Step 6: Mutation or transcriptional analysis of isolated tumour cells.
Figure 2
Figure 2
Composite image gallery showing staining characteristics of MDA-MB-231 cells and WBCs from a CellSearch cartridge after immunomagnetic enrichment with the CellSearch CTC kit visualised on the DEPArray system. (A) Tumour cells were defined using standard CellSearch CTC criteria being (1) round to oval shape, (2) presence of a clear DAPI-stained nucleus, (3) at least 50% overlap between the CK-PE-positive cytoplasm and the nucleus and (4) CD45-APC negativity. Separate images for PE, DAPI and APC fluorescence and bright field channels and merged CK-PE/DAPI and CD45-APC/DAPI images of three single MDA-MB-231 cells (top 3 rows) and two WBC (bottom 2 rows) are shown. (B) Scatter plot of mean fluorescence intensities for CK-PE (y axis) and CD45-APC (x axis) staining by the DEPArray software. Rectangular gates can be applied to aid quick identification of cells or populations of cells for cell sorting. Green dots represent CK+/CD45− MDA-MB-231 cells selected by the user. Red dots represent CK−/CD45+ WBCs. Grey dots represent unselected events.
Figure 3
Figure 3
Composite gel images of Ampli1 QC end-point PCR products of Ampli1 whole-genome amplified DNA of five single MDA-MB-231 tumour cells and two groups of tumour cells and WBCs used for KRAS mutation analysis, analysed on the Agilent 2100 Bioanalyzer. Genomic DNA of samples was considered to be successfully amplified if both of two control genomic DNA sequences were visualised. In this example, no amplification product was obtained in two single-cell samples and both negative control samples. No mutated or wild-type allele sequences were detected with the Therascreen KRAS mutation test in both single-cell samples that failed to pass Ampli1 amplification check (Table 3, experiment 1). NTC=negative template control; TC=tumour cell; WBC=white blood cell.
Figure 4
Figure 4
(A) Composite image gallery of MDA-MB-231 cells, MCF7 cells and WBCs from manually stained CellSearch Profile samples visualised on the DEPArray system. Images of a single MCF7 cell showing faint EPCAM-PE staining (row 1), a single MDA-MB-231 cell showing no EPCAM staining (row 2) and two EPCAM-/CD45+ WBCs (rows 3 and 4) are shown. (B) Unsupervised hierarchical clustering analysis comparing gene expression profiles of 1 to 10 MDA-MB-231 cells, MCF7 cells and WBCs isolated from spiked blood samples with the CellSearch Profile kit and the DEPArray system and corresponding positive control samples (PC). Data have been subjected to median normalisation for each individual marker across all samples. Red colour indicates a transcript level above the median and green colour indicates a transcript level below the median of the particular assay as measured in all samples. (C) Boxplots of normalised gene expression values of 1 to 10 MDA-MB-231 and MCF7 cells and two groups of 10 WBCs for the 9 marker transcripts. PC=positive control sample cDNA of 3–5 million MDA-MB-231 cells harvested from the same culture flask as the one used to perform the isolation of single cells and groups of tumour cells); NTC=negative template control; TC=tumour cell(s); WBC=white blood cell.

References

    1. Amir E, Miller N, Geddie W, Freedman O, Kassam F, Simmons C, Oldfield M, Dranitsaris G, Tomlinson G, Laupacis A, Tannock IF, Clemons M. Prospective study evaluating the impact of tissue confirmation of metastatic disease in patients with breast cancer. J Clin Oncol. 2012;30:587–592. - PMC - PubMed
    1. Attard G, Swennenhuis JF, Olmos D, Reid AHM, Vickers E, A'Hern R, Levink R, Coumans F, Moreira J, Riisnaes R, Oommen NB, Hawche G, Jameson C, Thompson E, Sipkema R, Carden CP, Parker C, Dearnaley D, Kaye SB, Cooper CS, Molina A, Cox ME, LWMM Terstappen, de Bono JS. Characterization of ERG, AR and PTEN gene status in circulating tumor cells from patients with castration-resistant prostate cancer. Cancer Res. 2009;69:2912–2918. - PubMed
    1. Berx G, Raspé E, Christofori G, Thiery JP, Sleeman JP. Pre-EMTing metastasis? Recapitulation of morphogenetic processes in cancer. Clin Exp Metastasis. 2007;24:587–597. - PubMed
    1. Cohen SJ, Punt CJ, Iannotti N, Saidman BH, Sabbath KD, Gabrail NY, Picus J, Morse M, Mitchell E, Miller MC, Doyle GV, Tissing H, Terstappen LW, Meropol NJ. Relationship of circulating tumor cells to tumor response, progression-free survival, and overall survival in patients with metastatic colorectal cancer. J Clin Oncol. 2008;26:3213–3221. - PubMed
    1. Collisson EA, Cho RJ, Gray JW. What are we learning from the cancer genome. Nat Rev Clin Oncol. 2012;9:621–630. - PMC - PubMed

Publication types

Substances