

How muscle fiber lengths and velocities affect muscle force generation as humans walk and run at different speeds
- PMID: 23470656
- PMCID: PMC3656509
- DOI: 10.1242/jeb.075697
How muscle fiber lengths and velocities affect muscle force generation as humans walk and run at different speeds
Abstract
The lengths and velocities of muscle fibers have a dramatic effect on muscle force generation. It is unknown, however, whether the lengths and velocities of lower limb muscle fibers substantially affect the ability of muscles to generate force during walking and running. We examined this issue by developing simulations of muscle-tendon dynamics to calculate the lengths and velocities of muscle fibers from electromyographic recordings of 11 lower limb muscles and kinematic measurements of the hip, knee and ankle made as five subjects walked at speeds of 1.0-1.75 m s(-1) and ran at speeds of 2.0-5.0 m s(-1). We analyzed the simulated fiber lengths, fiber velocities and forces to evaluate the influence of force-length and force-velocity properties on force generation at different walking and running speeds. The simulations revealed that force generation ability (i.e. the force generated per unit of activation) of eight of the 11 muscles was significantly affected by walking or running speed. Soleus force generation ability decreased with increasing walking speed, but the transition from walking to running increased the force generation ability by reducing fiber velocities. Our results demonstrate the influence of soleus muscle architecture on the walk-to-run transition and the effects of muscle-tendon compliance on the plantarflexors' ability to generate ankle moment and power. The study presents data that permit lower limb muscles to be studied in unprecedented detail by relating muscle fiber dynamics and force generation to the mechanical demands of walking and running.
Keywords: biomechanics; human gait; muscle architecture; musculoskeletal model; plantarflexors; simulation.
Figures
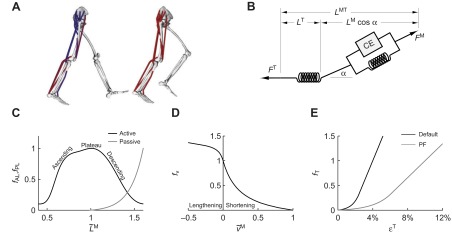
 , on the active and passive force generated by muscle fibers. The active force–length curve included ascending, plateau and descending regions. (D) The force–velocity curve modeled the effect, force–velocity multiplier fv, of normalized fiber velocity,
  , on the active force generated by muscle fibers. The force–velocity curve included shortening (
 ) and lengthening (
 ) regions. (E) The tendon force–strain curve modeled the proportion of maximum isometric force, tendon force–strain multiplier fT, in the tendon as a function of the strain in the tendon [
 ]. The force in the tendon would equal maximum isometric force (i.e. fT=1) at a tendon strain of 10% in the plantarflexors (PF) or 4% in all other muscles.
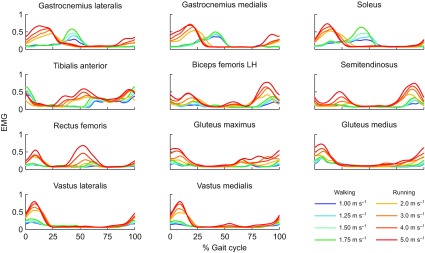
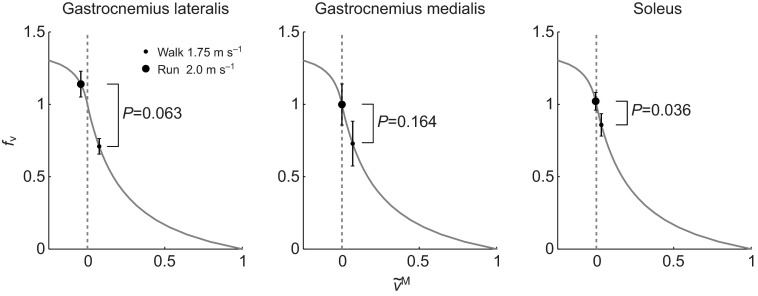
 ) and increased fv in soleus. We did not detect a significant difference between walking and running in gastrocnemius medialis and gastrocnemius lateralis.
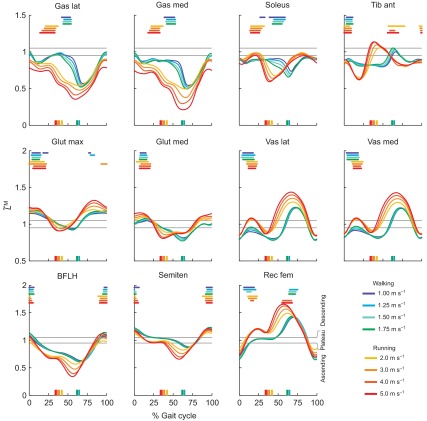
 ) and period of highest activation of 11 muscles during gait at four walking speeds and four running speeds (N=5). Colors indicate gait speed in walking (1.00–1.75 m s−1) and running (2.00–5.00 m s−1). Thick horizontal lines indicate portions of the gait cycle when a muscle's activation exceeded 80% of the maximum value for that speed. Vertical lines on the abscissa indicate the instant of toe off for each of the eight speeds. Thin grey lines bound the plateau of the force–length curve, where normalized fiber length is between 0.95 and 1.05.
 ) and period of highest activation of 11 muscles during gait at four walking speeds and four running speeds (N=5). Colors indicate gait speed in walking (1.00–1.75 m s−1) and running (2.00–5.00 m s−1). Thick horizontal lines indicate portions of the gait cycle when a muscle's activation exceeded 80% of the maximum value for that speed. Vertical lines on the abscissa indicate the instant of toe off for each of the eight speeds. When fibers are shortening, is positive; when fibers are lengthening, is negative.
References
-
- Arnold A. S., Asakawa D. J., Delp S. L. (2000). Do the hamstrings and adductors contribute to excessive internal rotation of the hip in persons with cerebral palsy? Gait Posture 11, 181-190 - PubMed
Publication types
MeSH terms
Grants and funding
LinkOut - more resources
Full Text Sources
Other Literature Sources
Miscellaneous
