Comparative Study
. 2013 Apr;41(8):4549-64.
doi: 10.1093/nar/gkt148. Epub 2013 Mar 6.

A comparison of dense transposon insertion libraries in the Salmonella serovars Typhi and Typhimurium

Affiliations
Comparative Study

A comparison of dense transposon insertion libraries in the Salmonella serovars Typhi and Typhimurium

Lars Barquist et al. Nucleic Acids Res. 2013 Apr.

Abstract

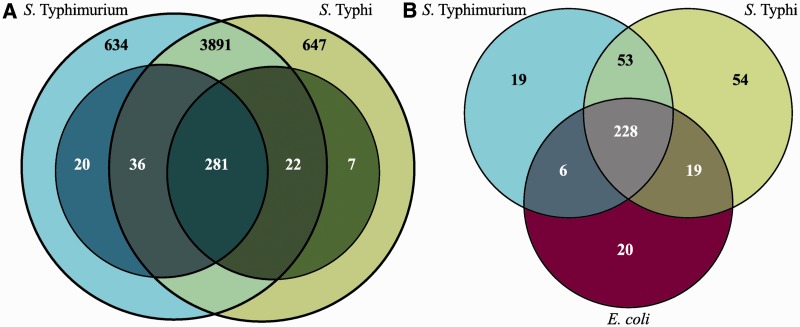
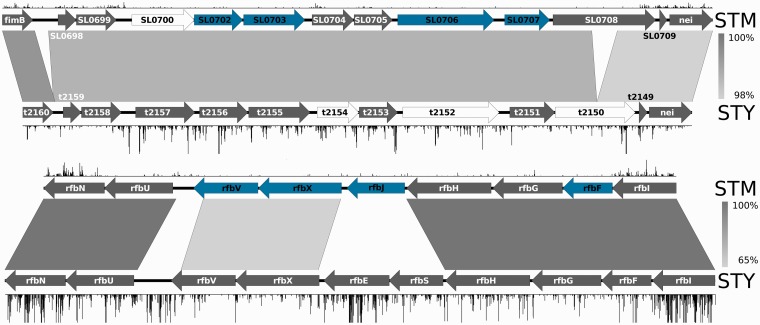
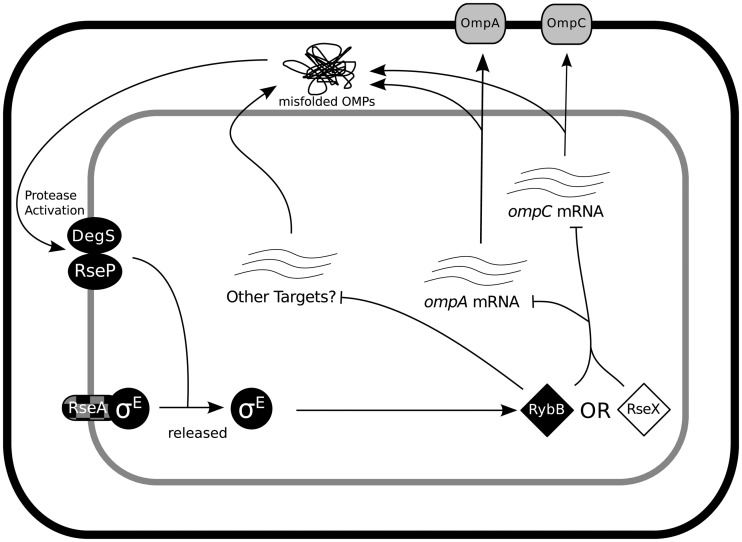
Salmonella Typhi and Typhimurium diverged only ∼50 000 years ago, yet have very different host ranges and pathogenicity. Despite the availability of multiple whole-genome sequences, the genetic differences that have driven these changes in phenotype are only beginning to be understood. In this study, we use transposon-directed insertion-site sequencing to probe differences in gene requirements for competitive growth in rich media between these two closely related serovars. We identify a conserved core of 281 genes that are required for growth in both serovars, 228 of which are essential in Escherichia coli. We are able to identify active prophage elements through the requirement for their repressors. We also find distinct differences in requirements for genes involved in cell surface structure biogenesis and iron utilization. Finally, we demonstrate that transposon-directed insertion-site sequencing is not only applicable to the protein-coding content of the cell but also has sufficient resolution to generate hypotheses regarding the functions of non-coding RNAs (ncRNAs) as well. We are able to assign probable functions to a number of cis-regulatory ncRNA elements, as well as to infer likely differences in trans-acting ncRNA regulatory networks.


Figures

Figure 1.
Figure 1.
Genome-wide transposon mutagenesis of S. Typhimurium. Circular plot showing gene content, distribution of required genes and insertion density along the S. Typhimurium chromosome. The outer scale is marked in megabases. Circular tracks range from 1 (outer track) to 6 (inner track). Track 1, all forward-strand genes (colour-coded according to function: dark blue, pathogenicity/adaptation; black, energy metabolism; red, information transfer; dark green, membranes/surface structures; cyan, degradation of macromolecules; purple, degradation of small molecules; yellow, central/intermediary metabolism; light blue, regulators; pink, phage/IS elements; orange, conserved hypothetical; pale green, unknown function; brown, pseudogenes.); track 2, all reverse-strand genes (colour-coded as for forward-strand genes); track 3, S. Typhimurium required genes (red); track 4, 56 genes required by S. Typhimurium, but not by S. Typhi (dark blue, see also Table 1); track 5, transposon insertion density; track 6, GC bias [(G − C)/(G + C)]), khaki indicates values >1; purple <1.
Figure 2.
Figure 2.
Comparison of required genes. Venn diagrams showing (A) the overlap of all genes (outer circles, light colours) and required genes (inner circles, dark colours) between S. Typhimurium and S. Typhi (excluding genes required in one serovar only, which do not have significantly different read-counts). Black numbers refer to all genes, white numbers to required genes. (B) the overlap of all required genes between S. Typhimurium (blue), S. Typhi (green) and E. coli (purple). White numbers refer to genes with Keio essentiality scores ≥0.5.
Figure 3.
Figure 3.
Comparison of cell surface operon structure and requirements. Diagram illustrating cell surface operons with different requirement patterns in S. Typhimurium and S. Typhi. The top figure is of an uncharacterized operon putatively involved in cell wall biogenesis, whereas the bottom figure shows a portion of the rfb operon involved in O-antigen biosynthesis. Plots along the top and bottom of each figure show insertions in S. Typhimurium and S. Typhi, respectively, with read depth on the y-axis with a maximum cut-off of 100 reads. Genes in blue are required in S. Typhimurium, genes in white are pseudogenes; others are in grey. Grey rectangles represent BLAST hits between orthologous genes, with percentage nucleotide identity coloured on the scale to the right of each figure.
Figure 4.
Figure 4.
Proposed differences in sRNA utilization. Diagram illustrating inferred required sRNA regulatory networks under TraDIS. Molecules required in S. Typhi are in black and in S. Typhimurium are in white. RseA, in black/grey check, is ambiguous in S. Typhi. Non-required molecules are in grey. Diamonds indicate sRNAs, circles regulatory proteins, ovals proteases, oblong shapes are membrane-anchored proteins, and rounded squares are outer membrane porins.

References

    1. Crump JA, Luby SP, Mintz ED. The global burden of typhoid fever. Bull World Health Organ. 2004;82:346–353. - PMC - PubMed
    1. Bhutta ZA, Threlfall J. Addressing the global disease burden of typhoid fever. JAMA. 2009;302:898–899. - PubMed
    1. Kothari A, Pruthi A, Chugh TD. The burden of enteric fever. J. Infect. Dev. Ctries. 2008;2:253–259. - PubMed
    1. Soper GA. The curious career of typhoid mary. Bull N.Y. Acad. Med. 1939;15:698–712. - PMC - PubMed
    1. CDC. (2009) Salmonella surveillance: Annual summary.

Publication types

MeSH terms

LinkOut - more resources