Review
. 2013 Apr;41(8):4360-77.
doi: 10.1093/nar/gkt157. Epub 2013 Mar 6.

Comparative genomics of defense systems in archaea and bacteria

Affiliations
Review

Comparative genomics of defense systems in archaea and bacteria

Kira S Makarova et al. Nucleic Acids Res. 2013 Apr.

Abstract

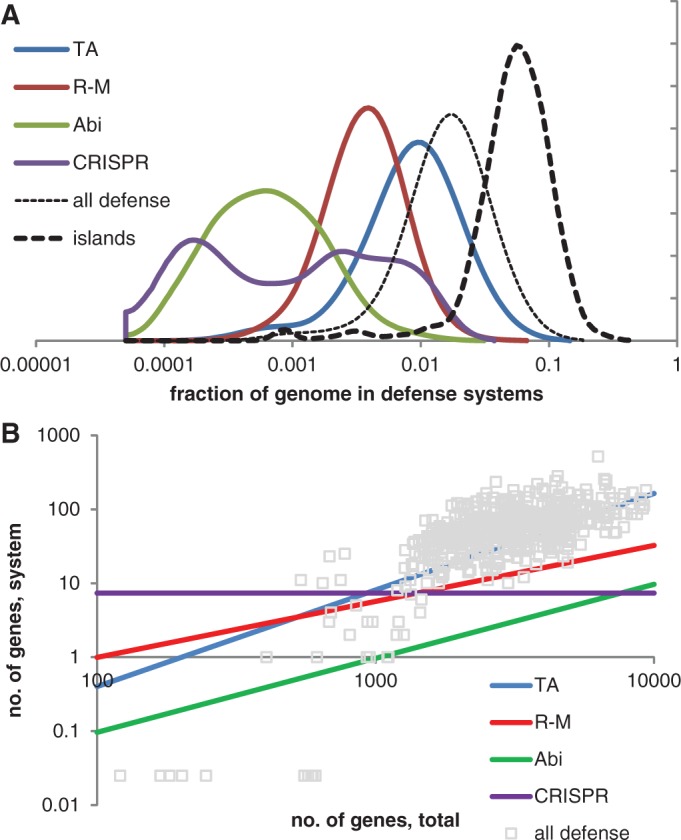
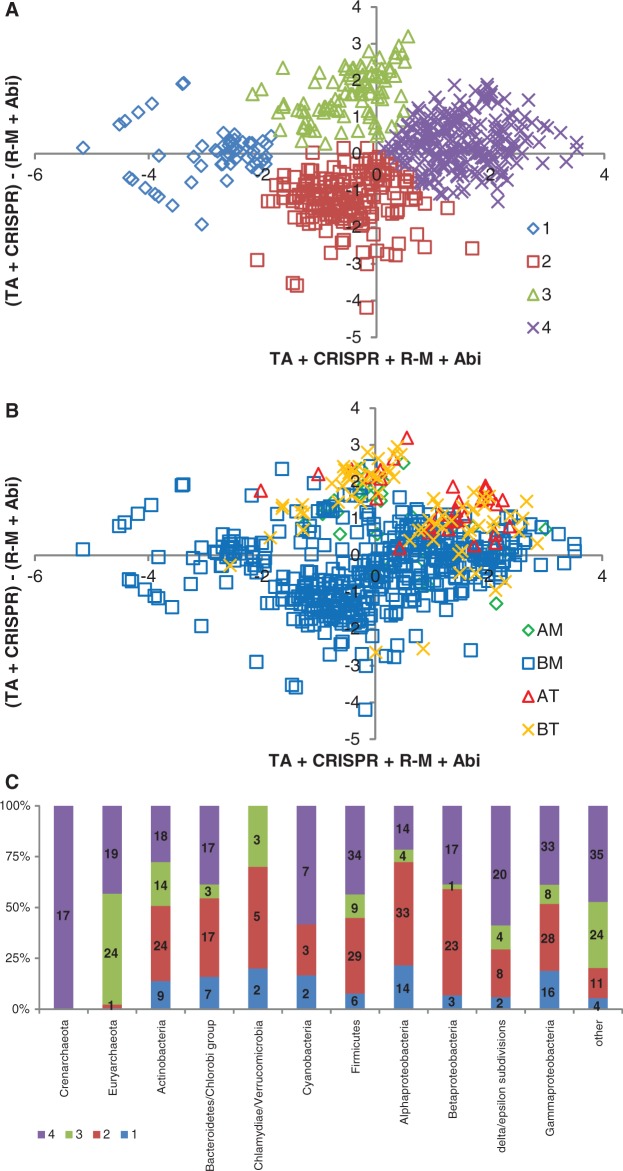
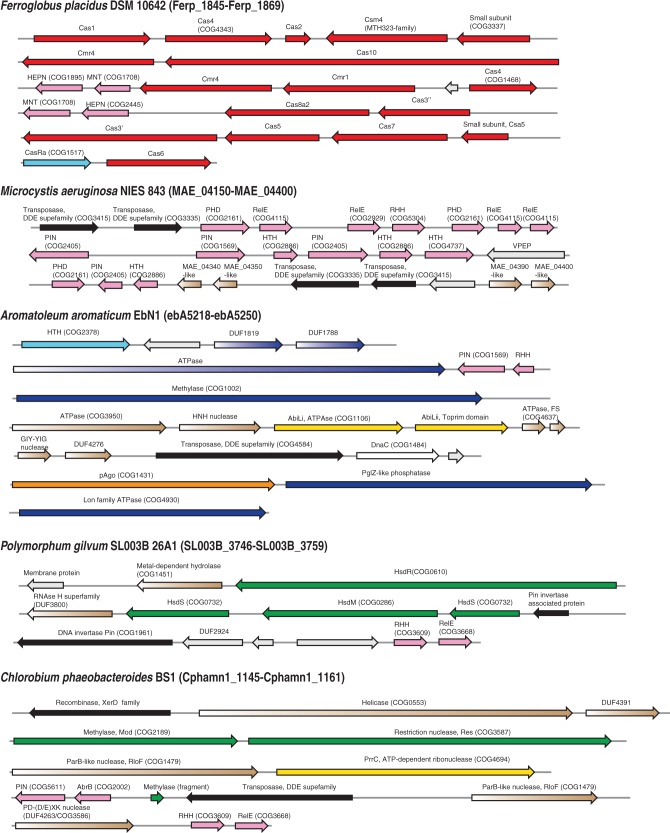
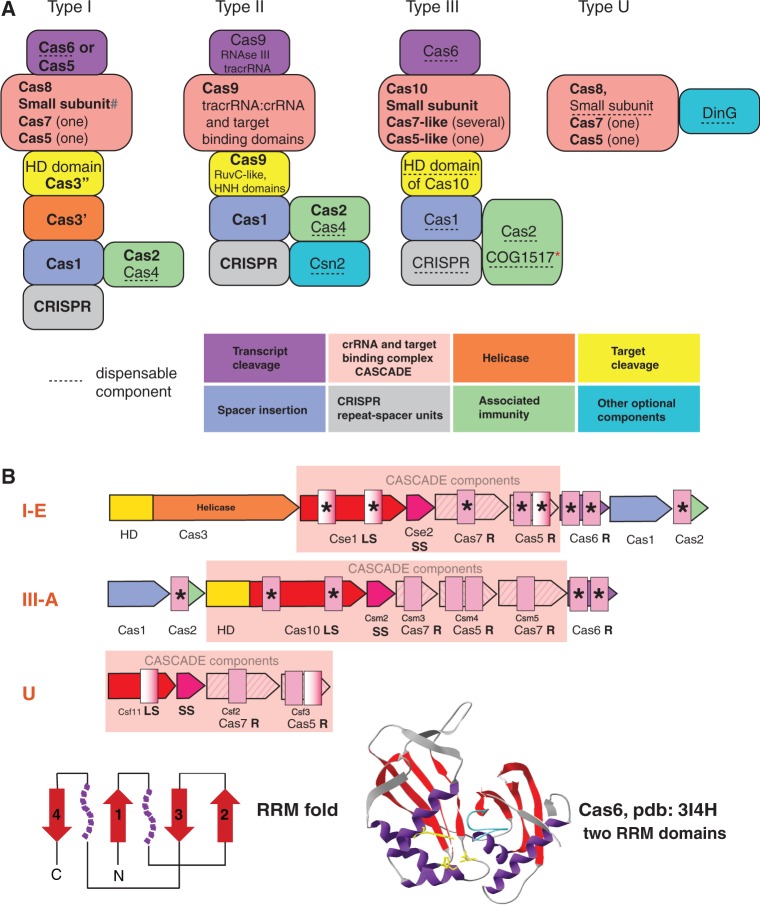
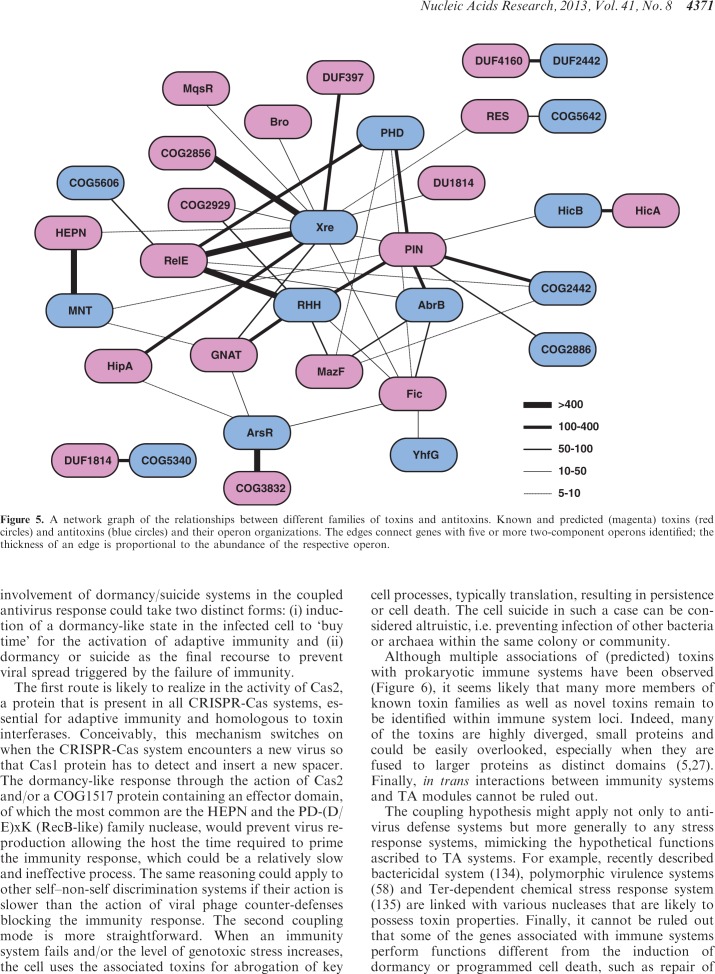
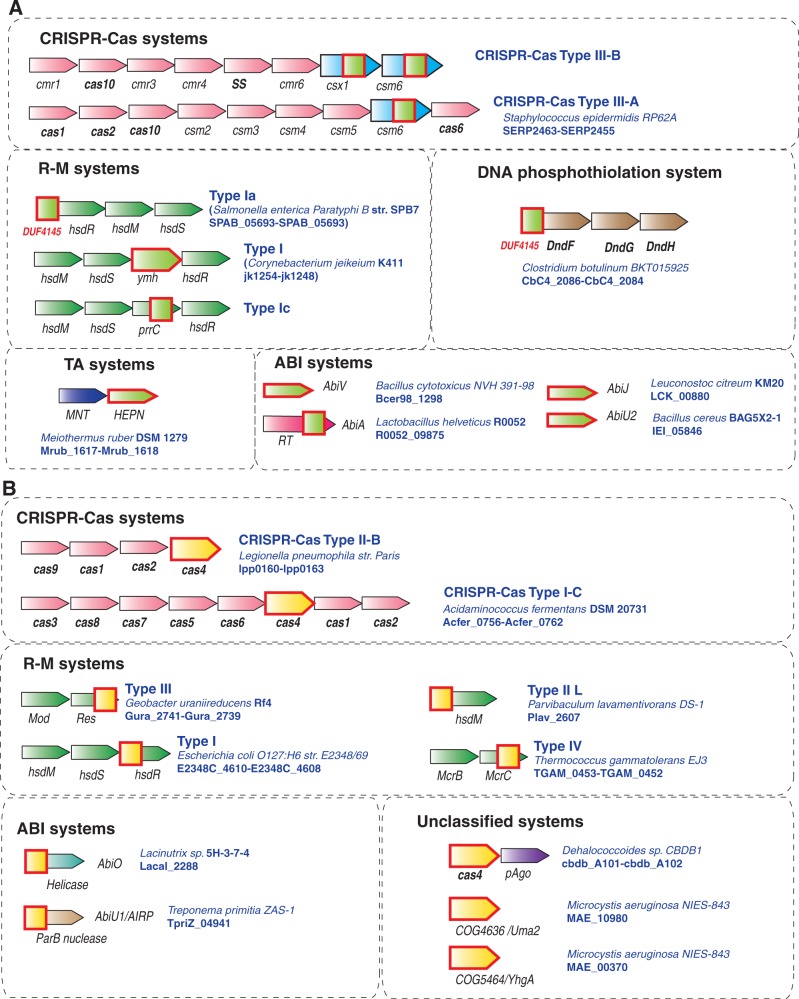
Our knowledge of prokaryotic defense systems has vastly expanded as the result of comparative genomic analysis, followed by experimental validation. This expansion is both quantitative, including the discovery of diverse new examples of known types of defense systems, such as restriction-modification or toxin-antitoxin systems, and qualitative, including the discovery of fundamentally new defense mechanisms, such as the CRISPR-Cas immunity system. Large-scale statistical analysis reveals that the distribution of different defense systems in bacterial and archaeal taxa is non-uniform, with four groups of organisms distinguishable with respect to the overall abundance and the balance between specific types of defense systems. The genes encoding defense system components in bacterial and archaea typically cluster in defense islands. In addition to genes encoding known defense systems, these islands contain numerous uncharacterized genes, which are candidates for new types of defense systems. The tight association of the genes encoding immunity systems and dormancy- or cell death-inducing defense systems in prokaryotic genomes suggests that these two major types of defense are functionally coupled, providing for effective protection at the population level.


Figures

Figure 1.
Figure 1.
The major types of defense systems in bacterial and archaeal genomes. (A) Distribution (probability density function) of the genome fraction occupied by defense systems in bacteria and archaea. (B) Scaling of the number of genes in defense systems with the total number of genes. A data set of 572 genomes (the largest genome in a genus with addition of E. coli K12 and B. subtilis subsp. subtilis) was selected to represent 1516 genomes that were completely sequenced and available through the NCBI Genome database as of February 2012.
Figure 2.
Figure 2.
Distribution of known and predicted defense systems in archaeal and bacterial genomes. (A) The four ‘defense strategies’. Here, 1–4 refers to the four strategies discussed in the text. The axes show logs of the ratios of the numbers of genes belonging to a given type of defense systems to the number expected from the scaling shown in Figure 1B. The horizontal axis is the sum of the logs for all four types and the vertical axis is (TA + CRISPR) − (R-M + ABI). (B) Defense strategies used by bacterial and archaeal thermophiles and mesophiles. BT, AT, BM and AM stand for bacterial thermophiles, archaeal thermophiles, bacterial mesophiles and archaeal mesophiles, respectively. The axes show logs of the ratios of the numbers of genes belonging to a given type of defense systems to the number expected from the scaling shown in Figure 1B. The horizontal axis is the sum of the logs for all four types and the vertical axis is (TA + CRISPR) − (R-M + ABI). (C) Distribution of the defense strategies among major prokaryotic taxa. Here, 1–4 refers to the four strategies discussed in the text. The number of analysed genomes for each taxon is indicated inside the respective bar. The expected abundance of genes belonging to the defense systems of each type in a given genome was calculated from the genome size using the observed scaling relationships (Figure 1B). Logarithms of the ratios of the observed and expected frequencies of defense system genes in genomes were analysed using Principal Component Analysis; then the data were projected into the space of two orthogonal axes with integer coefficients closest to the first principal components.
Figure 3.
Figure 3.
Examples of defense islands in archaeal and bacterial genomes. The genes are shown by block arrows with the size roughly proportional to the size of the corresponding gene. The genomic position of each region is indicated given in parentheses after the species name in the form of the range of genes denoted using the systematic names for the respective species. Colour coding is the following: pink are components of TA systems, read, components of CRISPR-Cas systems; dark blue, Pgl system; light blue, regulatory components; green, R-M systems; yellow, ABI system; orange, pAgo; brown, components that are spredicted to be involved in defense; grey, unknown protein. The protein family or domains names are provided above the respective arrows; some of these families were recently introduced and described in the course of comparative genomic analysis of defense islands (5); COG or Pfam families are indicated in parentheses. Pgl, Phage Growth Limitation; HTH, helix-turn-helix; RHH, ribbon-helix-helix; GIY-YIG, conserved motif in a nuclease family.
Figure 4.
Figure 4.
General principles of the structure and organization of four CRISPR-Cas types. (A) The building blocks of four distinct CRISPR-Cas system types. The cas genes and domain description for each building block are given. Gene names follow the current nomenclature and classification (18). The symbol ‘#’ indicates the putative small subunit that appears to be fused to the large subunit in several Type I subtypes (77). Asterisk indicates that those COG1517 family proteins that contain a third effector (toxin) domain are implicated in immunity-dormancy/suicide coupling. (B) RRM domain-containing proteins in CRISPR-Cas systems. General organization of operons is shown by arrows with size roughly proportional to the size of respective gene. Homologous genes are shown by the arrows of same colour or hashing. Colour coding is the same as in the (A). Gene and family names are taken from (18,77). Additional designations: LS, large subunit; SS, small subunit; R, RAMPs. RRM domains are shown by pink rectangles, with semitransparent rectangles indicating deteriorated RRM fold. The protein representing families with RRM domains for which structures have been solved are denoted by asterisks. A topology diagram of the RRM fold is shown in the bottom left: beta strands are shown by red arrows; the purple shapes each denotes a single alpha helix in the typical RRM fold that, however, are replaced by more complex secondary structure arrangements in some variants including RAMPs. The structure of Cas6, the typical RAMP superfamily protein with two RRM domains, is shown in the bottom right. The colours of the core RRM elements are the same as in the topology diagram; in addition, the glycine-rich loop, the signature feature of the RAMP superfamily proteins, is shown in blue; amino acids involved in catalysis are rendered in yellow.
Figure 5.
Figure 5.
A network graph of the relationships between different families of toxins and antitoxins. Known and predicted (magenta) toxins (red circles) and antitoxins (blue circles) and their operon organizations. The edges connect genes with five or more two-component operons identified; the thickness of an edge is proportional to the abundance of the respective operon.
Figure 6.
Figure 6.
Examples of genomic loci encoding different immunity systems and containing HEPN and PD-(D/E)xK domains. The genes are depicted as colored block arrows. The HEPN domain is shown by a light green shape with a red outline. The PD-(D/E)xK (RecB-like) domain is shown by a yellow shape with a red outline. HEPN, higher eukaryotes and prokaryotes nucleotide-binding domain, predicted endoribonuclease (54); Sir2, ParB and PD-(D/E)xK, DEDD are nucleases from distinct superfamilies. CRISPR-Cas gene names follow the nomenclature and classification from (18); R-M names follow the nomenclature and classification from (38). (A) HEPN domain associations. (B) PD-(D/E)xK domain associations.

References

    1. Stern A, Sorek R. The phage-host arms race: shaping the evolution of microbes. Bioessays. 2011;33:43–51. - PMC - PubMed
    1. Koonin EV, Wolf YI. Evolution of microbes and viruses: a paradigm shift in evolutionary biology? Front. Cell. Infect. Microbiol. 2012;2:119. - PMC - PubMed
    1. Forterre P, Prangishvili D. The great billion-year war between ribosome- and capsid-encoding organisms (cells and viruses) as the major source of evolutionary novelties. Ann. NY Acad. Sci. 2009;1178:65–77. - PubMed
    1. Haaber J, Samson JE, Labrie SJ, Campanacci V, Cambillau C, Moineau S, Hammer K. Lactococcal abortive infection protein AbiV interacts directly with the phage protein SaV and prevents translation of phage proteins. Appl. Environ. Microbiol. 2010;76:7085–7092. - PMC - PubMed
    1. Makarova KS, Wolf YI, Snir S, Koonin EV. Defense islands in bacterial and archaeal genomes and prediction of novel defense systems. J. Bacteriol. 2011;193:6039–6056. - PMC - PubMed

Publication types

Substances