. 2013 Apr;41(7):e89.
doi: 10.1093/nar/gkt126. Epub 2013 Mar 6.

An empirical Bayesian framework for somatic mutation detection from cancer genome sequencing data

Affiliations

An empirical Bayesian framework for somatic mutation detection from cancer genome sequencing data

Yuichi Shiraishi et al. Nucleic Acids Res. 2013 Apr.

Abstract

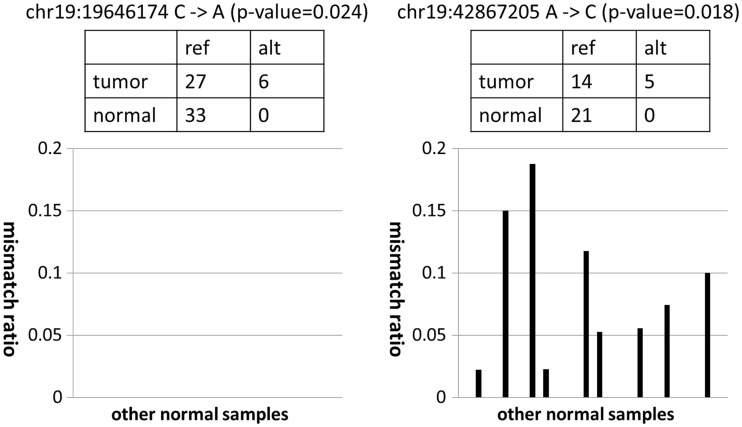
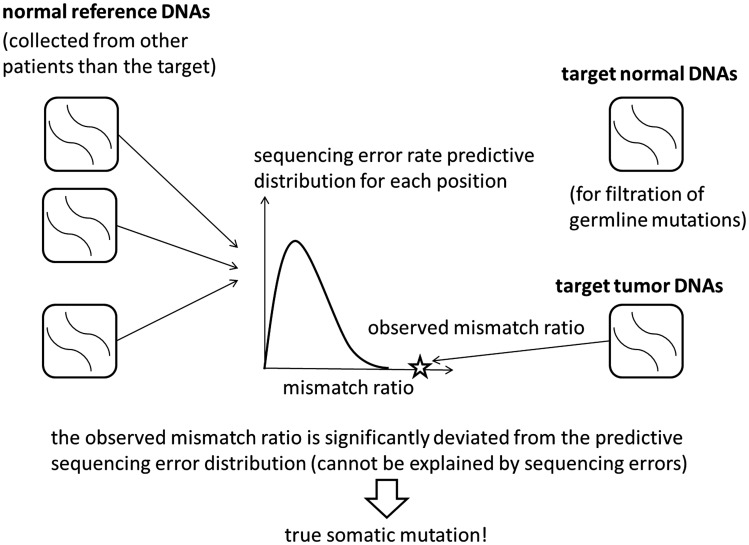
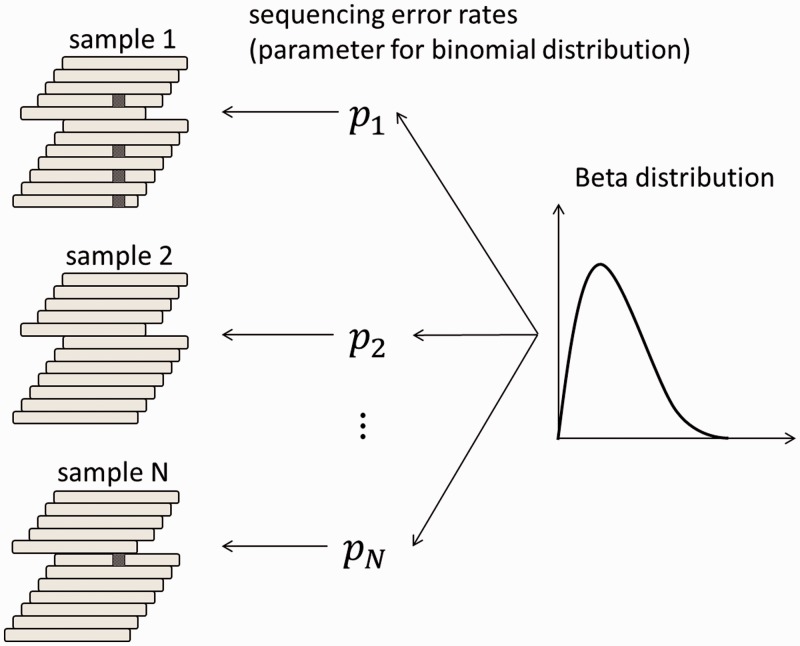
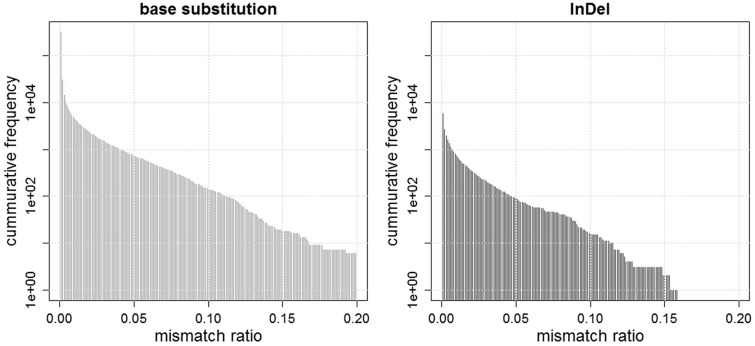
Recent advances in high-throughput sequencing technologies have enabled a comprehensive dissection of the cancer genome clarifying a large number of somatic mutations in a wide variety of cancer types. A number of methods have been proposed for mutation calling based on a large amount of sequencing data, which is accomplished in most cases by statistically evaluating the difference in the observed allele frequencies of possible single nucleotide variants between tumours and paired normal samples. However, an accurate detection of mutations remains a challenge under low sequencing depths or tumour contents. To overcome this problem, we propose a novel method, Empirical Bayesian mutation Calling (https://github.com/friend1ws/EBCall), for detecting somatic mutations. Unlike previous methods, the proposed method discriminates somatic mutations from sequencing errors based on an empirical Bayesian framework, where the model parameters are estimated using sequencing data from multiple non-paired normal samples. Using 13 whole-exome sequencing data with 87.5-206.3 mean sequencing depths, we demonstrate that our method not only outperforms several existing methods in the calling of mutations with moderate allele frequencies but also enables accurate calling of mutations with low allele frequencies (≤ 10%) harboured within a minor tumour subpopulation, thus allowing for the deciphering of fine substructures within a tumour specimen.


Figures

Figure 1.
Figure 1.
Examples of mismatch ratios of other normal samples for mutation candidates with moderate P-values. In both cases, although the mismatch ratios of the target tumour sample were relatively high, the numbers of corresponding supporting variant reads were small. For the candidate on the left, the frequencies of non-reference alleles for other normal samples were consistently zero. Therefore, this supports the prediction that the observed variant reads in the target tumour sample came from a true somatic mutation and not from sequencing errors. On the other hand, for the candidate on the right, we often observed high frequencies of non-reference alleles for several different normal samples. Therefore, the observed variant reads in the target tumour sample likely came from sequencing errors, and it was just by chance that there was no variant read in the target normal sample.
Figure 2.
Figure 2.
An illustrative description of the proposed method. For each genomic site, the distribution of sequencing errors is estimated using non-paired normal samples from patients other than the target. The mismatch ratio of the target tumour sample is then compared with the distribution. If the mismatch ratio deviates significantly from the distribution, the corresponding variant is then extracted as a somatic mutation candidate. The target normal sample is used for filtering germline mutations.
Figure 3.
Figure 3.
A Beta-binomial sequencing error model. First, the error rate for each sample is generated from the Beta distribution. The number of short reads with sequencing errors is then generated according to the binomial distribution using the parameters of the above error rate for each sample. The parameters of the Beta distribution, which determine the shape of the distribution, are given for each possible variant.
Figure 4.
Figure 4.
Two bar plots showing the numbers of base substitutions and InDels, whose mean mismatch ratios are above the determined threshold values. For instance, the numbers of base substitutions with mean mismatch ratios of more than 0.01, 0.02, and 0.05 are 4472, 2232, and 727, respectively, while those of InDels are 717, 350, and 89, respectively.
Figure 5.
Figure 5.
A comparison of scatter plots of the mean mismatch ratios of the base substitution and InDels for two sets consisting of 10 ccRCC normal samples each (upper), and 10 ccRCC normal samples and 10 ped-AML normal samples (lower). The correlation coefficients are 0.777, 0.723, 0.943 and 0.917 for the upper-left, lower-left, upper-right and lower-right panels, respectively.
Figure 6.
Figure 6.
Comparative performance for EBCall (20 ccRCC or ped-AML normal samples used as normal reference sets), Genomon-Fisher, VarScan 2 and SomaticSniper. The horizontal and vertical axes show the number of candidate somatic mutations and true positives (when changing the threshold of the confidence score for each method) verified by whole genome and whole transcriptome data, respectively.
Figure 7.
Figure 7.
(Left) The comparative results between EBCall and Genomon-Fisher. Each point, in which the sequencing depth and variant allele frequency are indicated, shows the candidate somatic mutations called by both or either of the two methods. The threshold values are determined such that the false positive rates are 0.05. The green and red points show true positive mutations called by both of the two methods, and only EBCall, respectively. The yellow, cyan and magenta points show false positive mutations called by both of the two methods, only EBCall, and only Genomon-Fisher, respectively. The numbers of green, red, yellow, cyan and magenta points are 506, 51, 20, 9 and 6, respectively. There are no true positive mutations called by Genomon-Fisher exclusively. (Right) The P-values of Fisher’s exact test and the mean mismatch ratio of 20 ccRCC normal samples are plotted. The red and blue points show true positive mutations called and not called by EBCall, respectively. On the other hand, the cyan and magenta points show false positive mutations called and not called by EBCall, respectively. The yellow vertical line shows the threshold value of the Genomon-Fisher determined with false positive rates of 0.05.
Figure 8.
Figure 8.
Histograms of the allele frequencies of validated mutations for RCC31 (left), RCC88 (centre) and RCC102 (right).

References

    1. Meyerson M, Gabriel S, Getz G. Advances in understanding cancer genomes through second-generation sequencing. Nat. Rev. Genet. 2010;11:685–696. - PubMed
    1. Shah SP, Morin RD, Khattra J, Prentice L, Pugh T, Burleigh A, Delaney A, Gelmon K, Guliany R, Senz J, et al. Mutational evolution in a lobular breast tumour profiled at single nucleotide resolution. Nature. 2009;461:809–813. - PubMed
    1. Ding L, Ley TJ, Larson DE, Miller CA, Koboldt DC, Welch JS, Ritchey JK, Young MA, Lamprecht T, McLellan MD, et al. Clonal evolution in relapsed acute myeloid leukaemia revealed by whole-genome sequencing. Nature. 2012;481:506–510. - PMC - PubMed
    1. Shah SP, Roth A, Goya R, Oloumi A, Ha G, Zhao Y, Turashvili G, Ding J, Tse K, Haffari G, et al. The clonal and mutational evolution spectrum of primary triple-negative breast cancers. Nature. 2012;486:395–399. - PMC - PubMed
    1. Nik-Zainal S, Van Loo P, Wedge DC, Alexandrov LB, Greenman CD, Lau KW, Raine K, Jones D, Marshall J, Ramakrishna M, et al. The life history of 21 breast cancers. Cell. 2012;149:994–1007. - PMC - PubMed

Publication types