. 2013 Apr;8(4):639-51.
doi: 10.1038/nprot.2013.024. Epub 2013 Mar 7.

Mass spectrometry of intact membrane protein complexes

Affiliations

Mass spectrometry of intact membrane protein complexes

Arthur Laganowsky et al. Nat Protoc. 2013 Apr.

Abstract

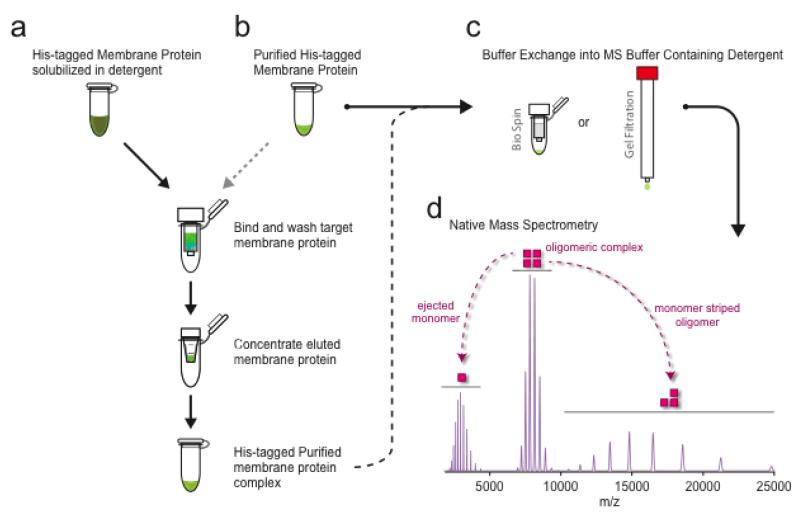
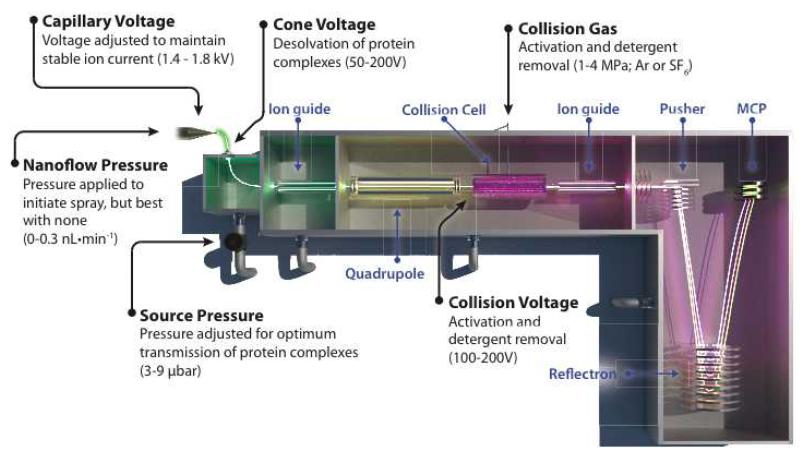
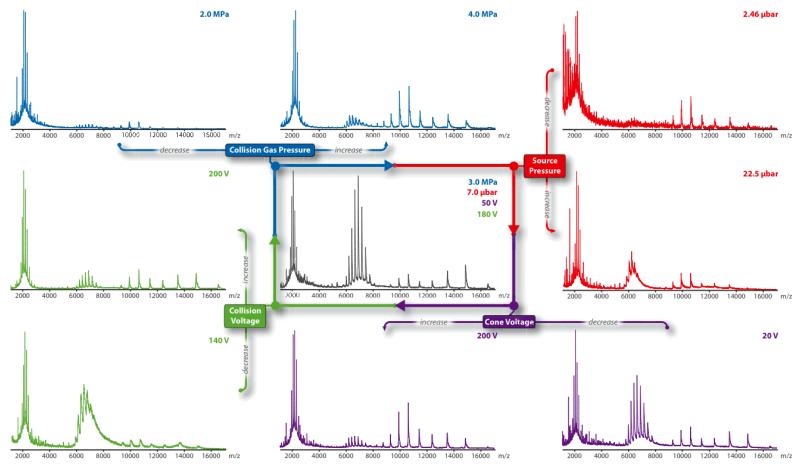
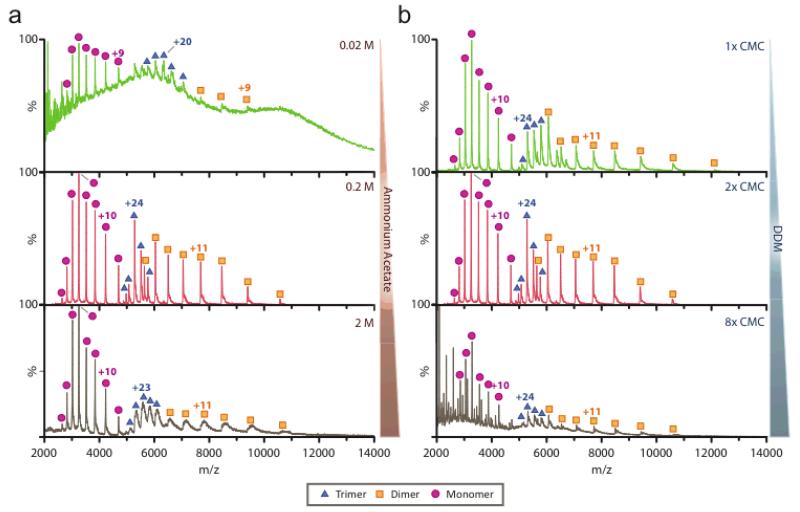
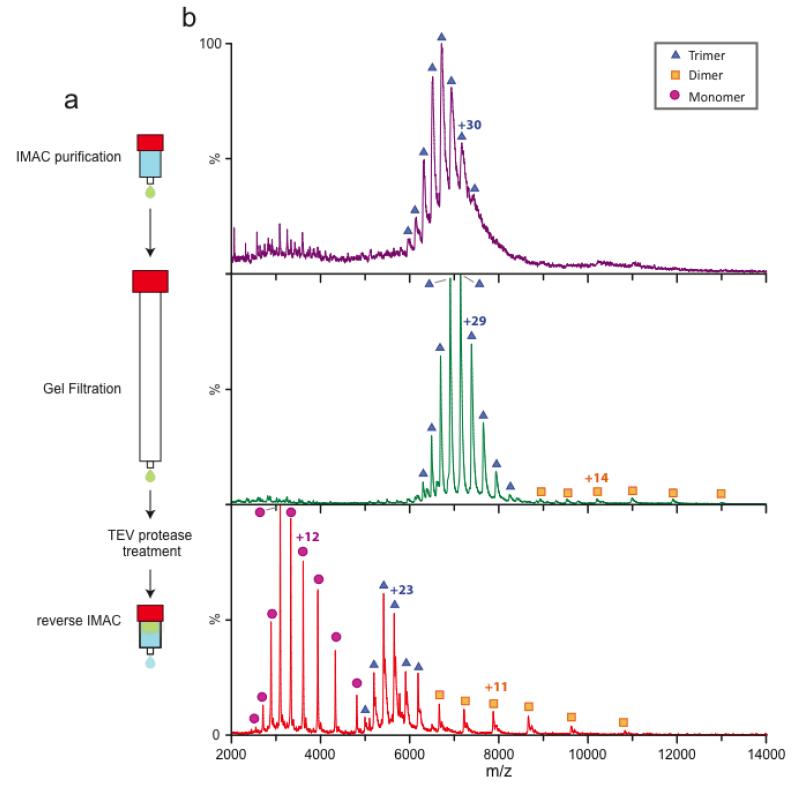
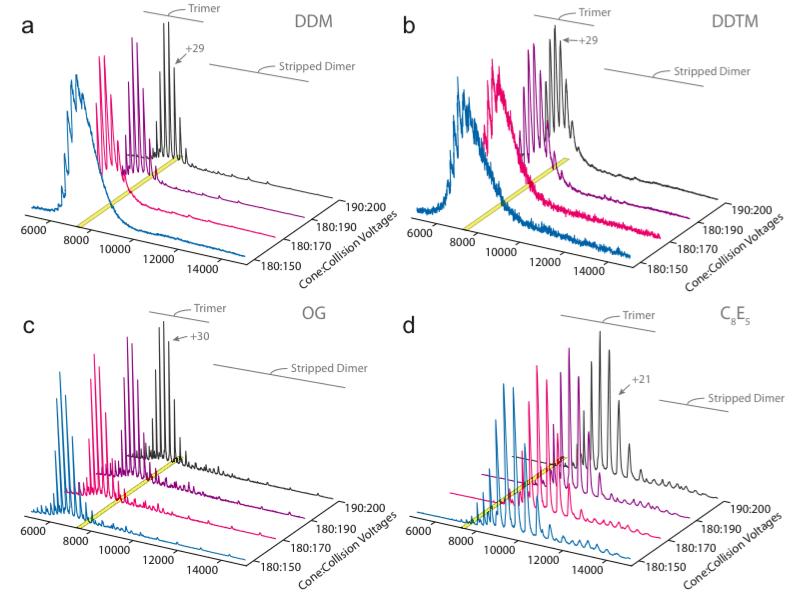
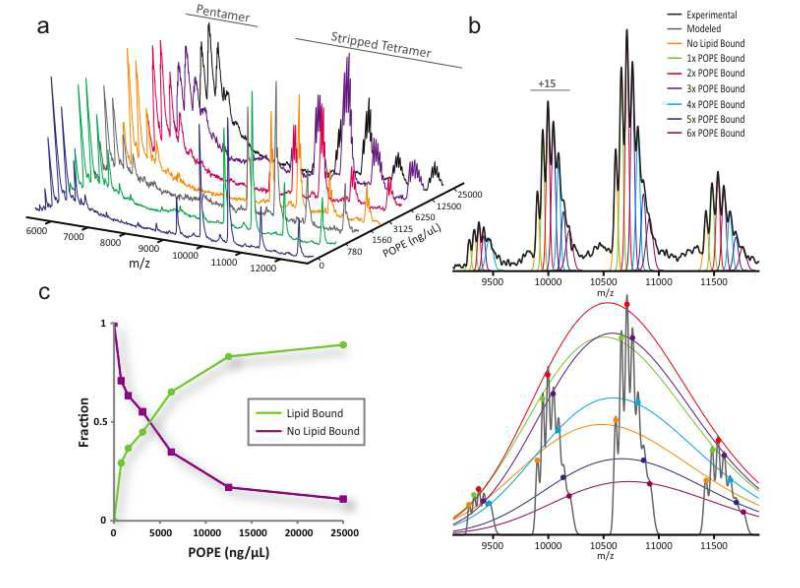
Mass spectrometry (MS) of intact soluble protein complexes has emerged as a powerful technique to study the stoichiometry, structure-function and dynamics of protein assemblies. Recent developments have extended this technique to the study of membrane protein complexes, where it has already revealed subunit stoichiometries and specific phospholipid interactions. Here we describe a protocol for MS of membrane protein complexes. The protocol begins with the preparation of the membrane protein complex, enabling not only the direct assessment of stoichiometry, delipidation and quality of the target complex but also the evaluation of the purification strategy. A detailed list of compatible nonionic detergents is included, along with a protocol for screening detergents to find an optimal one for MS, biochemical and structural studies. This protocol also covers the preparation of lipids for protein-lipid binding studies and includes detailed settings for a quadrupole time-of-flight (Q-TOF) mass spectrometer after the introduction of complexes from gold-coated nanoflow capillaries.


Figures

Figure 1
Figure 1. An overview of a typical membrane protein purification and preparation, and analysis by mass spectrometry of the intact complex
(a) Purified membranes containing over-expressed membrane protein fused to green fluorescent protein (GFP) and His-tag is solubilized in a detergent of interest. Solubilized membrane protein is purified using immobilized metal affinity chromatography (IMAC) and concentrated prior to preparation for native mass spectrometry (MS). (b) Detergent can be screened or optimized starting with a purified membrane protein and follow the procedure outlined above to exchange into a different detergent. Furthermore, membrane proteins can be prepared from solubilized membranes in different detergents followed by purification using IMAC. (c) Purified membrane proteins are buffer exchanged into an MS-compatible buffer containing two times the critical micelle concentration (CMC) of the detergent of interest. Typically buffer exchange centrifugal devices, such as a Bio Spin device, are used. Alternatively, buffer exchange can also be achieved using a small analytical gel filtration column. (d) Theoretical mass spectrum for a tetrameric membrane protein complex (200 kDa) with a protein monomeric mass of 50 kDa. Under MS conditions, the oligomeric or tetrameric complex, centered around 8,500 m/z, undergoes collisional induced disassociation. Activation results in the ejection of a highly charged monomer, centered around 3,500 m/z, and a monomer stripped oligomer or oligomeric complex minus the ejected monomer, spanning the region 10,000 to 25,000 m/z.
Figure 2
Figure 2. Schematic of a Q-TOF mass spectrometer used for mass measurements of intact membrane protein complexes
Parts of the instrument are labeled in blue and parameters described in this protocol are labeled in black with ranges of typical operating settings in parenthesis. A membrane protein complex undergoes nanoelectrospray through the applied capillary voltage and ionized species are desolvated prior to transmission into the MS (green ion beam). The ions enter the source where the pressure is raised to increase the transmission efficiency of large protein complexes. Next, ions pass through the quadrupole (yellow ion beam) prior to being accelerated into the collision cell (purple ion beam) filled with inert gas molecules to release the protein complex from the detergent micelle. The resulting activated species are transferred to the time-of-flight (TOF) section, where ion species are resolved by their time to traverse a known distance. Shown here is the trajectory for ions of an oligomeric complex (red ion beam) and the resulting activated species, ejected monomer (blue ion beam) and stripped oligomer (green ion beam). Note that the ejected monomer and stripped oligomer ion paths are shorter and longer, respectively, compared to the parent oligomeric complex.
Figure 3
Figure 3. Optimization scheme of critical mass spectrometer parameters for membrane protein native MS
Four mass spectrometer parameters are optimized for the membrane protein complex of interest: collision gas pressure (blue), source pressure (red), cone voltage (purple), and collision energy (green). Shown here are the effects of altering individual mass spectrometer parameters on the pentameric ligand-gated ion channel of Erwinia chrysanthemi (ELIC) from optimized mass spectrometer conditions (grey spectra). Optimized conditions for the center spectrum are shown in the upper right as color-coded text to individual parameters described above. In general, optimization is achieved by adjusting parameters to maximize resolution and transmission of the oligomeric membrane protein complex. Collision gas, usually Argon, and sometimes SF6, at low operating pressures results in inefficient detergent micelle removal whereas at high pressures it lowers the transmission of oligomeric complexes. Higher source pressure is necessary to transmit large ions, however excessive pressure whether lower or higher lead to poor transmission of ions or peak broadening, respectively. The majority of activation of membrane protein complexes is achieved through adjusting the cone and collision energy voltages. Typically the collision energy is set to a higher value compared to the cone voltage. These two parameters are adjusted to produce resolved spectra while trying not to over activate the oligomeric complex, for example when collision energy is set to 200 V in this example.
Figure 4
Figure 4. Effect of ammonium acetate and detergent concentration on mass spectra of the E. coli ammonium channel, AmtB
Mass spectra were collected at constant high activation instrument settings. (a) Purified trimeric AmtB channel was buffer exchanged into Mem MS Buffer containing 2× CMC DDM at various concentrations of ammonium acetate. Lower and higher buffer concentrations diminish mass spectra quality. (b) Dilution and addition of DDM to solutions of buffer exchanged AmtB in 200 mM ammonium acetate. Moderate and considerable resolution is lost in 1× and 8× CMC preparations, respectively. At high detergent concentrations, broad peaks are observed corresponding to detergent aggregates, for example in the 2,000 to 4,000 m/z range of the 8× CMC mass spectrum.
Figure 5
Figure 5. Additional purification steps lead to an improvement in the overall quality of mass spectra for AmtB
The trimeric AmtB was expressed as a tobacco etch mosaic virus (TEV) protease cleavable N-terminal fusion to GFP and 6× His-tag (AmtB-GFP). (a) General outline for the purification of membrane protein complexes for native MS. Solubilized AmtB-GFP is first purified by IMAC then concentrated and further purified by gel filtration chromatography. The C-terminal fusion is removed by TEV protease treatment and further purified by reverse IMAC resulting in highly purified membrane protein complexes. (b) Native mass spectra at various time points in the purification process. After IMAC purification (top panel, purple) the ion peaks are broad for the trimeric complex with no disassociation products observed. Post gel filtration (middle panel, green) the ion peaks are improved for the trimeric complex along with disassociation products, monomer and dimer. The final purification step is removal of the C-terminal fusion which results in resolved mass spectra for both the trimeric complex and disassociation complexes (bottom panel, red). In general, we find that removal of the C-terminal fusion leads to more disassociation products.
Figure 6
Figure 6. Mass spectra activation series for selected detergents from a detergent screen on AmtB-GFP
Purified AmtB-GFP in DDM was used as the starting material in a detergent screen (see Figure 1b and BOX 2) to find detergents that improve mass spectra quality. The trimer and stripped dimer regions of the mass spectrum are shown as a function of activation energy – increasing cone and collision voltages. The yellow shaded region highlights the peak for the +29 charge state of the AmtB-GFP trimeric complex. (a) AmtB-GFP detergent exchanged into DDM, serving as the control in this experiment, highlights the activation energy required to emerge the membrane protein from the DDM micelle. (b) Detergent exchange into DDTM resulted in broad peaks and increased activation energy, similarly to several other detergents. (c) AmtB-GFP exchanged into OG produced well-resolved mass spectra even at the lowest activation energy comparable to the highest activation energy for DDM. (d) C8E5, a polyoxyethylene glycol detergent, reduced the average charge state of the trimeric complex similarly to others within this detergent family (Table 2). Notice that the trimeric complex has shifted from one centered at 7,000 m/z to 9,500 m/z corresponding roughly to a charge state reduction of eight. A detergent screen can be useful when trying to improve and/or lower the activation energy to obtain resolved mass spectra of membrane proteins.
Figure 7
Figure 7. Monitoring phsopholipid binding and stoichiometry
ELIC, a pentameric membrane protein complex, titrated with solutions of 1-palmitoyl-2-oleoyl-sn-glycero-3-phosphoethanolamine (POPE) prepared as described in BOX 3 and incubated at room temperature prior to measurement. (a) Mass spectra series of ELIC equilibrated with increasing concentrations of POPE. Shown are the pentamer and stripped tetramer regions of the mass spectrum. Peak broadening of the ELIC pentamer ion series (6,000 to 7,500 m/z) occurs with increasing concentrations of lipid. In contrast, ion series are resolved for various POPE bound states in the stripped tetramer region (8,000 to 13,000 m/z). (b) Data analysis of the resolved lipid bound states within the stripped tetramer region of the mass spectrum from ELIC incubated with 25 μg/mL of POPE. Multiple Gaussian peaks were modeled using least squares regression for various lipid bound states for each individual charge state to the experimental data (top panel). Peak centers and height values from these modeled Gaussian peaks are then extracted and fitted with a charge state envelope for individual lipid bound states (bottom panel). The resulting values for the fitted charge state envelopes reflect the fraction of various lipid bound states within the mass spectrum. (c) Plot of the fraction ELIC unbound and sum of ELIC bound to lipid.

References

    1. Dorsam RT, Gutkind JS. G-protein-coupled receptors and cancer. Nat Rev Cancer. 2007;7:79–94. doi:10.1038/nrc2069. - PubMed
    1. Lappano R, Maggiolini M. G protein-coupled receptors: novel targets for drug discovery in cancer. Nat Rev Drug Discov. 2011;10:47–60. doi:10.1038/nrd3320. - PubMed
    1. Barrera NP, Di Bartolo N, Booth PJ, Robinson CV. Micelles protect membrane complexes from solution to vacuum. Science. 2008;321:243–246. doi:10.1126/science.1159292. - PubMed
    1. Barrera NP, Robinson CV. Advances in the mass spectrometry of membrane proteins: from individual proteins to intact complexes. Annu Rev Biochem. 2011;80:247–271. doi:10.1146/annurev-biochem-062309-093307. - PubMed
    1. Zhou M, et al. Mass spectrometry of intact V-type ATPases reveals bound lipids and the effects of nucleotide binding. Science. 2011;334:380–385. doi:10.1126/science.1210148. - PMC - PubMed

Publication types

MeSH terms