Comparative Study
. 2013 May 1;187(9):933-42.
doi: 10.1164/rccm.201208-1449OC.

A dynamic bronchial airway gene expression signature of chronic obstructive pulmonary disease and lung function impairment

Affiliations
Comparative Study

A dynamic bronchial airway gene expression signature of chronic obstructive pulmonary disease and lung function impairment

Katrina Steiling et al. Am J Respir Crit Care Med. .

Abstract

Rationale: Molecular phenotyping of chronic obstructive pulmonary disease (COPD) has been impeded in part by the difficulty in obtaining lung tissue samples from individuals with impaired lung function.

Objectives: We sought to determine whether COPD-associated processes are reflected in gene expression profiles of bronchial airway epithelial cells obtained by bronchoscopy.

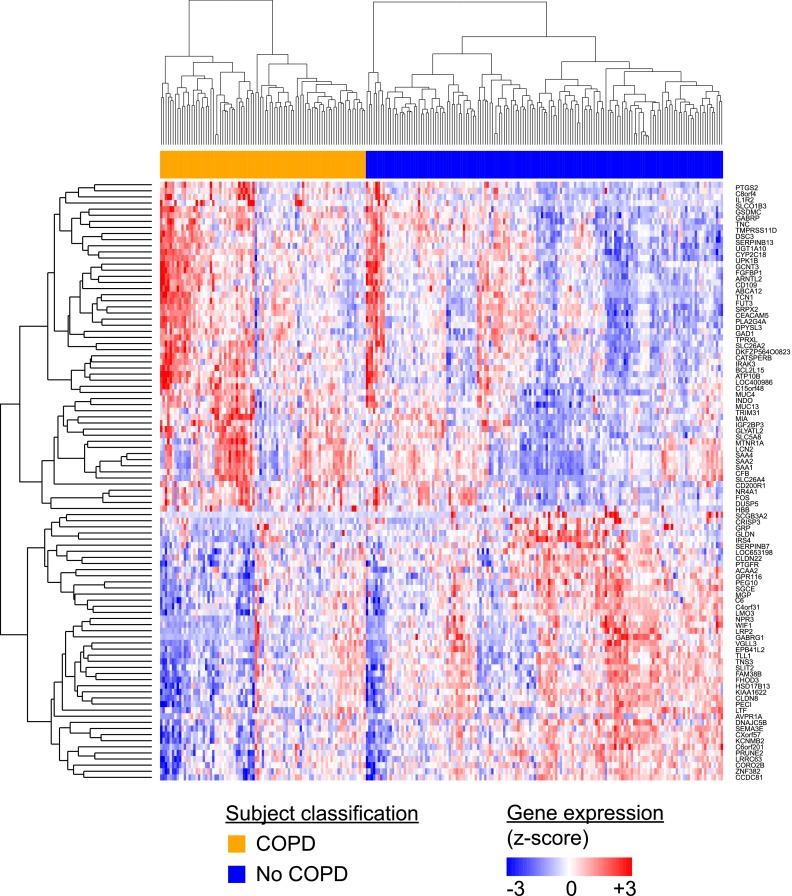
Methods: Gene expression profiling of bronchial brushings obtained from 238 current and former smokers with and without COPD was performed using Affymetrix Human Gene 1.0 ST Arrays.

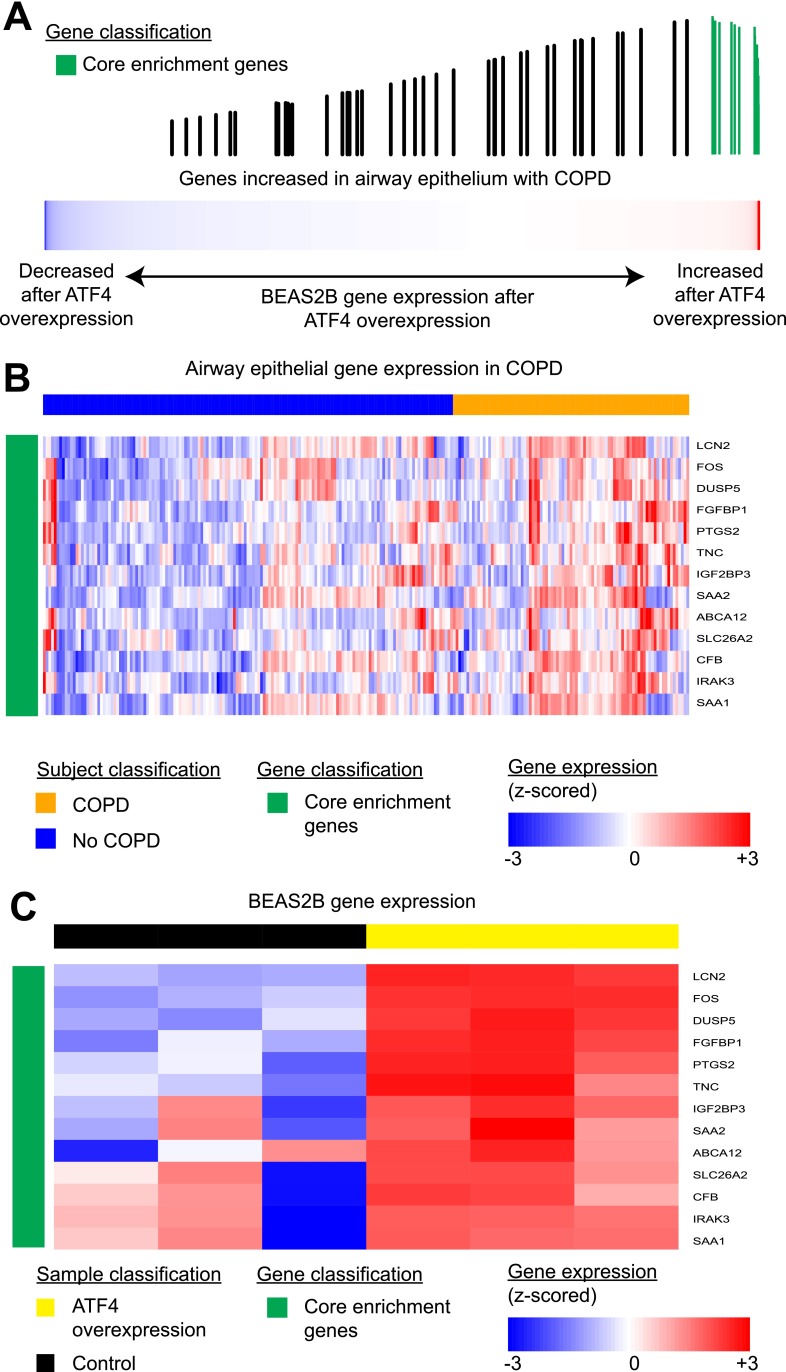
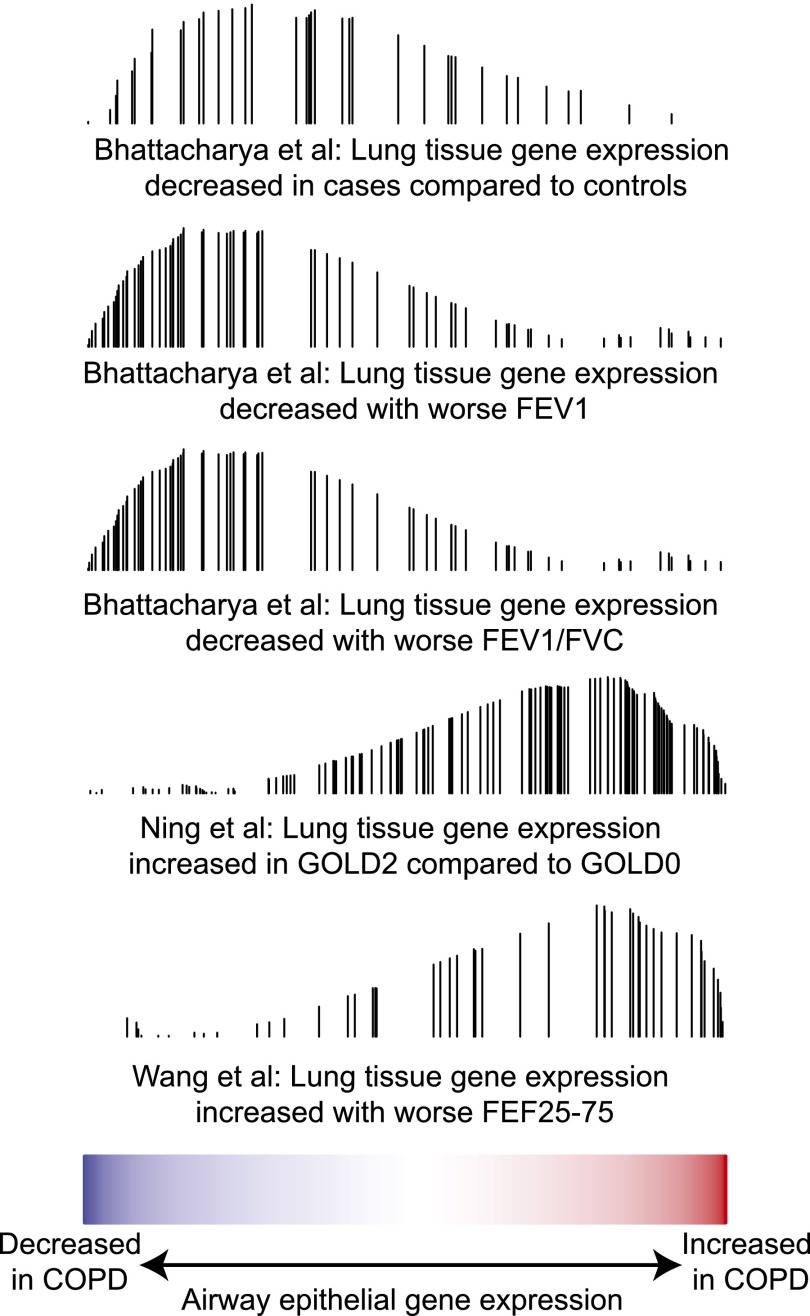
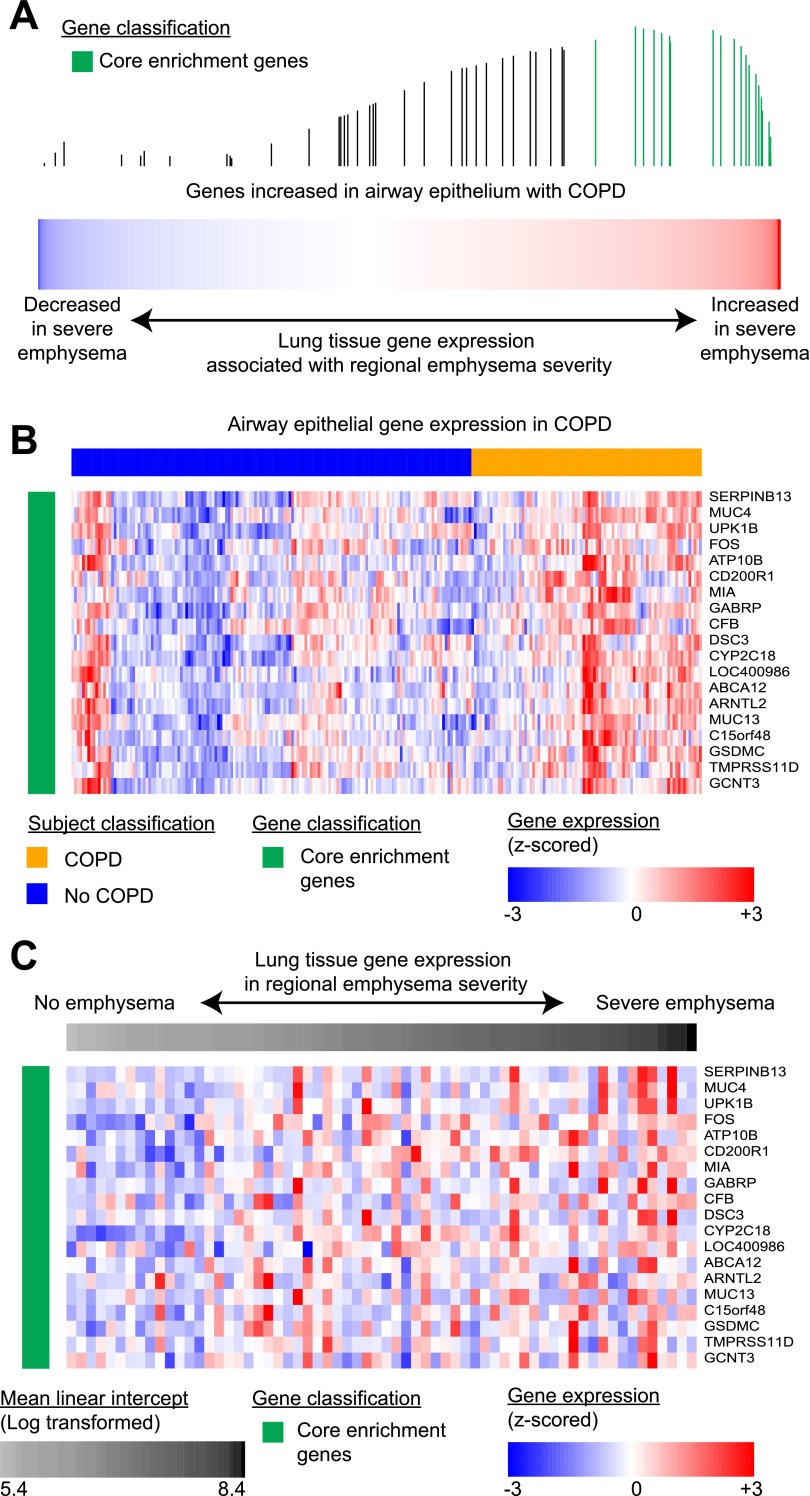
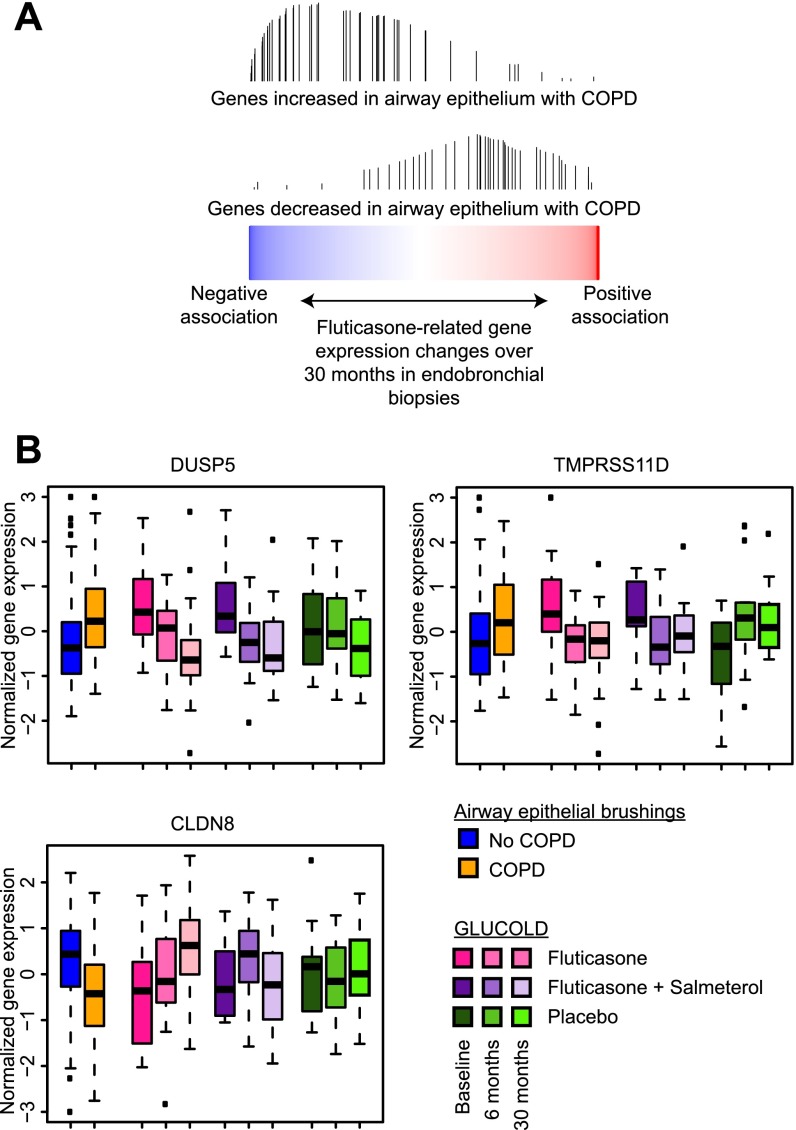
Measurements and main results: We identified 98 genes whose expression levels were associated with COPD status, FEV1% predicted, and FEV1/FVC. In silico analysis identified activating transcription factor 4 (ATF4) as a potential transcriptional regulator of genes with COPD-associated airway expression, and ATF4 overexpression in airway epithelial cells in vitro recapitulates COPD-associated gene expression changes. Genes with COPD-associated expression in the bronchial airway epithelium had similarly altered expression profiles in prior studies performed on small-airway epithelium and lung parenchyma, suggesting that transcriptomic alterations in the bronchial airway epithelium reflect molecular events found at more distal sites of disease activity. Many of the airway COPD-associated gene expression changes revert toward baseline after therapy with the inhaled corticosteroid fluticasone in independent cohorts.

Conclusions: Our findings demonstrate a molecular field of injury throughout the bronchial airway of active and former smokers with COPD that may be driven in part by ATF4 and is modifiable with therapy. Bronchial airway epithelium may ultimately serve as a relatively accessible tissue in which to measure biomarkers of disease activity for guiding clinical management of COPD.


Figures

<i>Figure 1.</i>
Figure 1.
Semisupervised heatmap of the 98 genes associated with chronic obstructive pulmonary disease (COPD) and continuous measures of lung function. A total of 107 genes were associated with COPD, 110 genes with FEV1% predicted, and 101 genes with FEV1/FVC (false discovery rate < 0.05; fold change > 1.25). Ninety-eight genes were in common to all of these measures. These results demonstrate that airway epithelial gene expression reflects the presence of COPD and the severity of lung function impairment.
<i>Figure 2.</i>
Figure 2.
ATF4 overexpression in BEAS2B cells in vitro recapitulates the in vivo airway gene expression signature of chronic obstructive pulmonary disease (COPD). (A) Gene set enrichment analysis demonstrates enrichment of genes with increased expression in airway epithelium from individuals with COPD among genes whose expression is increased with ATF4 overexpression in BEAS2B cells (false discovery rate < 0.05). Genes are ranked from left to right based on their ATF4-associated expression pattern in vitro. The position of each vertical bar indicates the position of a gene with COPD-associated gene expression in airway epithelium within this ranked list. The height of this bar represents the running gene set enrichment analysis enrichment score. Core enrichment genes are highlighted in green. (B) Expression levels of the core enrichment genes (green) in the bronchial brushing samples, all of which are predicted targets of ATF4 (P < 0.001) (17, 18), are shown in this heatmap supervised by COPD status (orange, COPD; blue, normal). (C) Expression levels of the core enrichment genes (green) with ATF4 overexpression in airway epithelium in vitro (black, negative control; yellow, ATF4 overexpression).
<i>Figure 3.</i>
Figure 3.
Airway epithelial gene expression associated with chronic obstructive pulmonary disease (COPD) is concordant with previously published microarray datasets of COPD lung tissue. Airway gene expression associated with COPD was compared with gene lists identified in previous studies of lung tissue gene expression in COPD using gene set enrichment analysis. The color bar indicates the strength of association of airway epithelial gene expression with COPD as measured by the t statistic for the COPD term after adjusting for covariates. The position of each vertical bar from left to right indicates the position of a gene from one of the previously published lung parenchyma gene sets (genes whose expression was previously identified to be associated with a COPD-related trait) within the ranked airway gene list. The height of this bar represents the running gene set enrichment analysis enrichment score. This analysis identified concordant enrichment of previously reported COPD-associated gene expression changes in lung tissue and COPD-associated changes in gene expression in the bronchial airway (false discovery rate < 0.05), and suggests that there is a common COPD effect in both tissues.
<i>Figure 4.</i>
Figure 4.
The airway transcriptomic alterations in chronic obstructive pulmonary disease (COPD) reflect gene expression changes associated with emphysema severity in lung tissue. (A) Gene set enrichment analysis demonstrates enrichment of genes whose expression levels in the airway epithelium significantly increased in COPD among genes whose expression is increased with worsening emphysema severity in lung tissue (false discovery rate < 0.05). Genes are ranked from left to right based on their emphysema-associated expression pattern in lung tissue. The position of each vertical bar indicates the position of a gene whose expression in airway epithelium is associated with COPD within this ranked list. The height of this bar represents the running gene set enrichment analysis enrichment score. The core enrichment genes are highlighted in green. (B) Expression of the core enrichment genes (green) in the bronchial brushing samples is shown in this heatmap supervised by COPD status (orange, COPD; blue, normal). (C) Expression of the core enrichment genes (green) in lung tissue samples is shown in this heatmap supervised by emphysema severity (light gray, no emphysema; black, severe emphysema).
<i>Figure 5.</i>
Figure 5.
Gene expression changes in the airway of subjects with chronic obstructive pulmonary disease (COPD) are modulated by inhaled corticosteroids. (A) Using gene set enrichment analysis, we identified enrichment of airway gene expression associated with COPD in an independent gene expression dataset of endobronchial biopsies obtained at 0, 6, and 30 months from individuals with COPD randomized to receive fluticasone (n = 25), salmeterol and fluticasone (n = 20), or placebo (n = 23). Many genes increased in COPD decreased with fluticasone, and genes decreased in COPD increased with fluticasone. Genes are ranked from left to right based on their association with the time by treatment interaction effect. The position of each vertical bar indicates the position of a gene whose expression in airway epithelium is associated with COPD within this ranked list (the upper plot includes genes increased in COPD; the lower plot includes genes decreased in COPD). The height of this bar represents the running gene set enrichment analysis score. (B) Boxplots illustrate the expression levels of three core enrichment genes in the bronchial airway epithelium of subjects with COPD (n = 87) compared with subjects without COPD (n = 151) and in an independent cohort of subjects randomized to receive fluticasone-containing therapies or placebo (n = 55 subjects with ≥1 time point). The y axis represents the z score normalized residual matrix after adjusting for RNA integrity number, treatment, time, and patient effect.

Comment in

References

    1. National Heart Lung and Blood Institute. NHLBI Fiscal Year 2010 Fact Book [2010; accessed 2013 Apr 10]. Available from: http://www.nhlbi.nih.gov/about/factbook-10/FactBook_2010.pdf.
    1. Murphy SL, Xu J, Kochanek KD. Deaths: preliminary data for 2012. National Vital Statistics Reports. Vol 60, No 4. Hyattsville, MD: National Center for Health Statistics; 2012.
    1. Spira A, Beane J, Pinto-Plata V, Kadar A, Liu G, Shah V, Celli B, Brody JS. Gene expression profiling of human lung tissue from smokers with severe emphysema. Am J Respir Cell Mol Biol. 2004;31:601–610. - PubMed
    1. Golpon HA, Coldren CD, Zamora MR, Cosgrove GP, Moore MD, Tuder RM, Geraci MW, Voelkel NF. Emphysema lung tissue gene expression profiling. Am J Respir Cell Mol Biol. 2004;31:595–600. - PubMed
    1. Ning W, Li CJ, Kaminski N, Feghali-Bostwick CA, Alber SM, Di YP, Otterbein SL, Song R, Hayashi S, Zhou Z, et al. Comprehensive gene expression profiles reveal pathways related to the pathogenesis of chronic obstructive pulmonary disease. Proc Natl Acad Sci USA. 2004;101:14895–14900. - PMC - PubMed

Publication types

MeSH terms