

Acute SIV infection in sooty mangabey monkeys is characterized by rapid virus clearance from lymph nodes and absence of productive infection in germinal centers
- PMID: 23472105
- PMCID: PMC3589484
- DOI: 10.1371/journal.pone.0057785
Acute SIV infection in sooty mangabey monkeys is characterized by rapid virus clearance from lymph nodes and absence of productive infection in germinal centers
Abstract
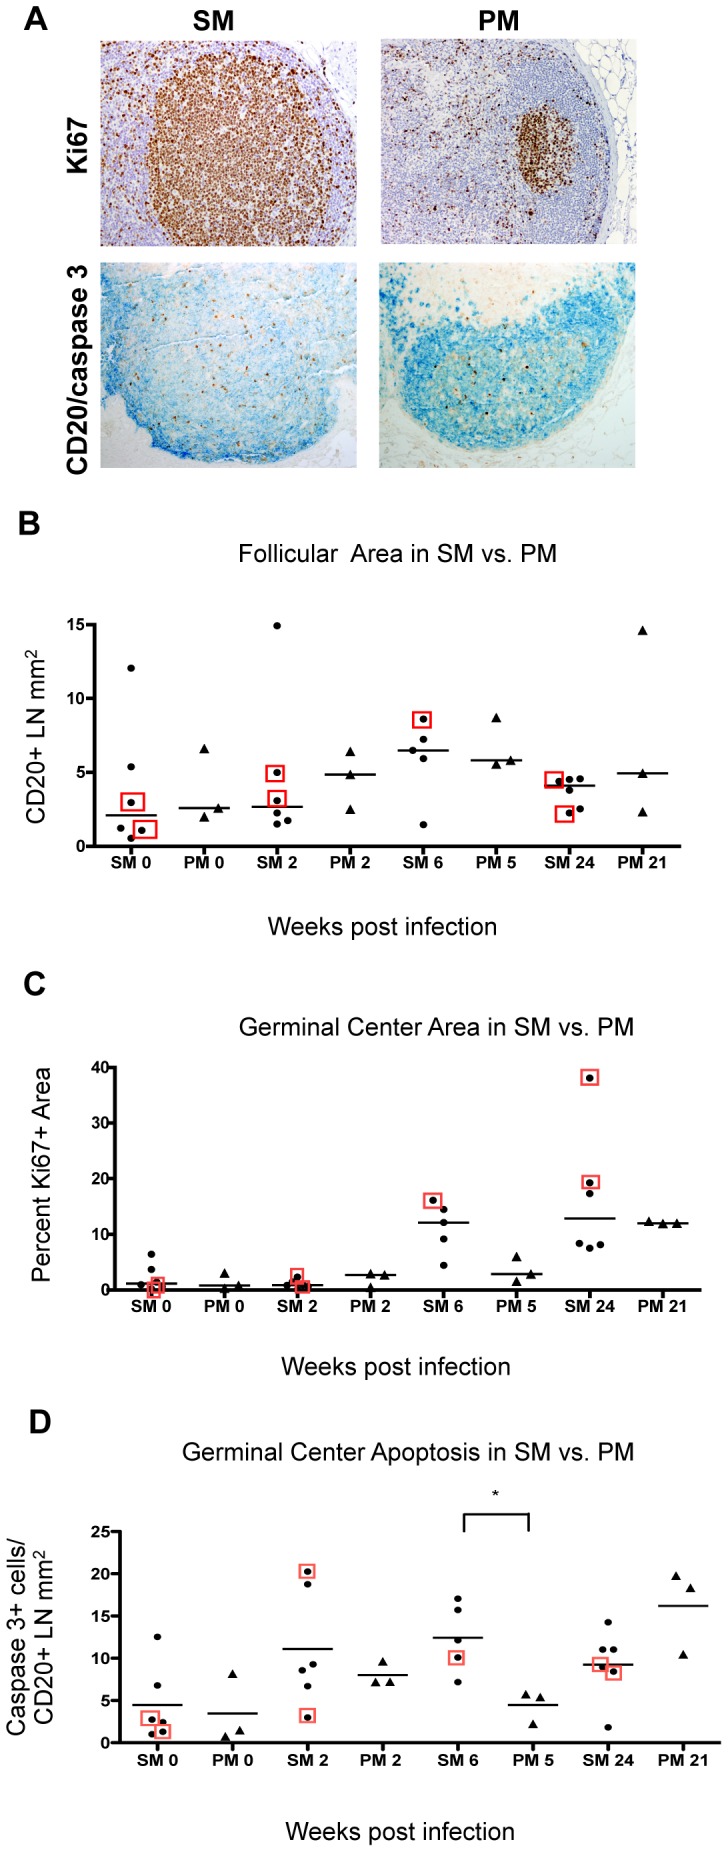
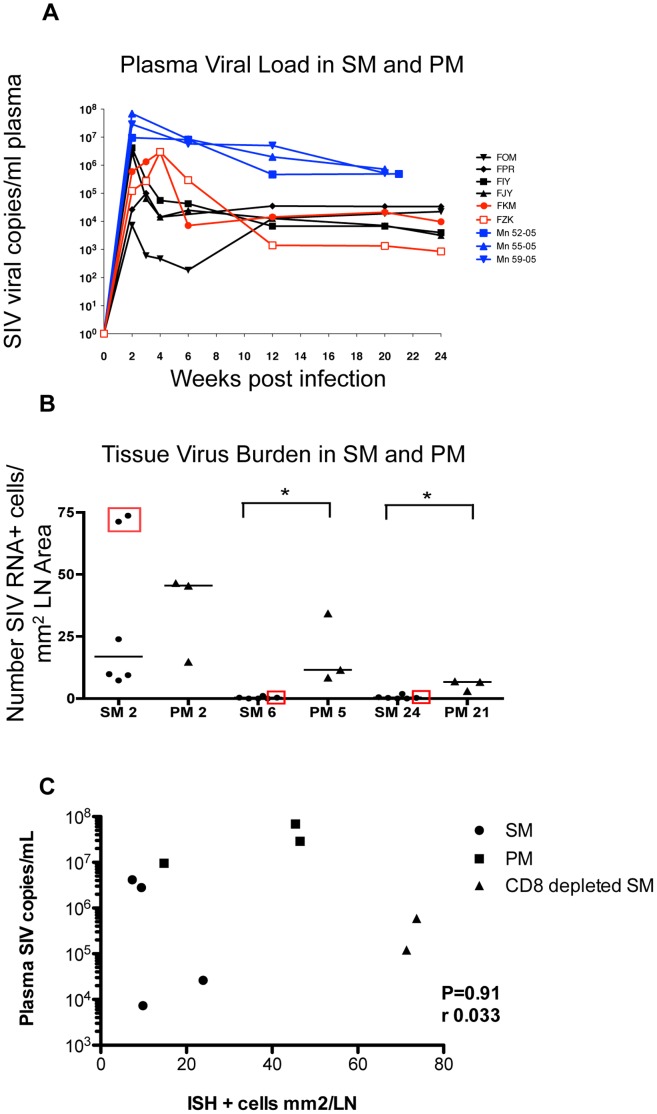
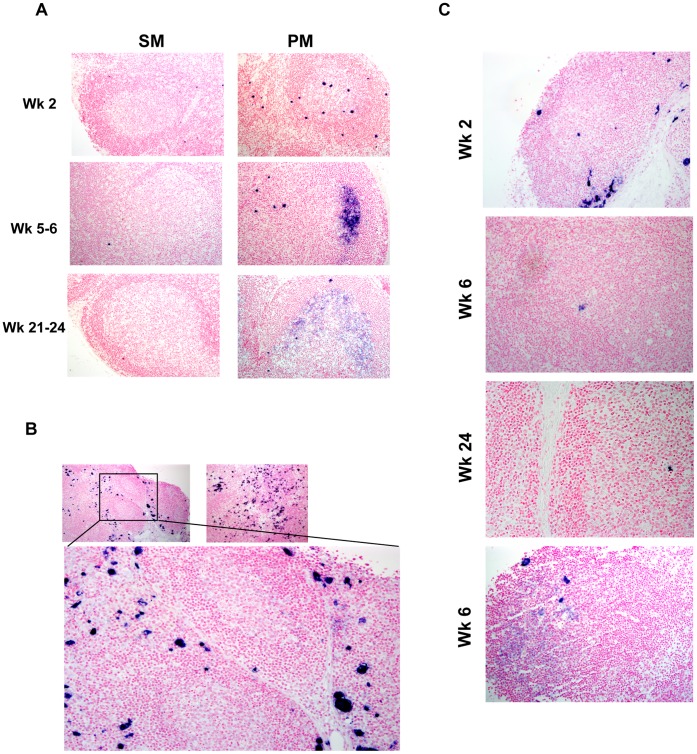
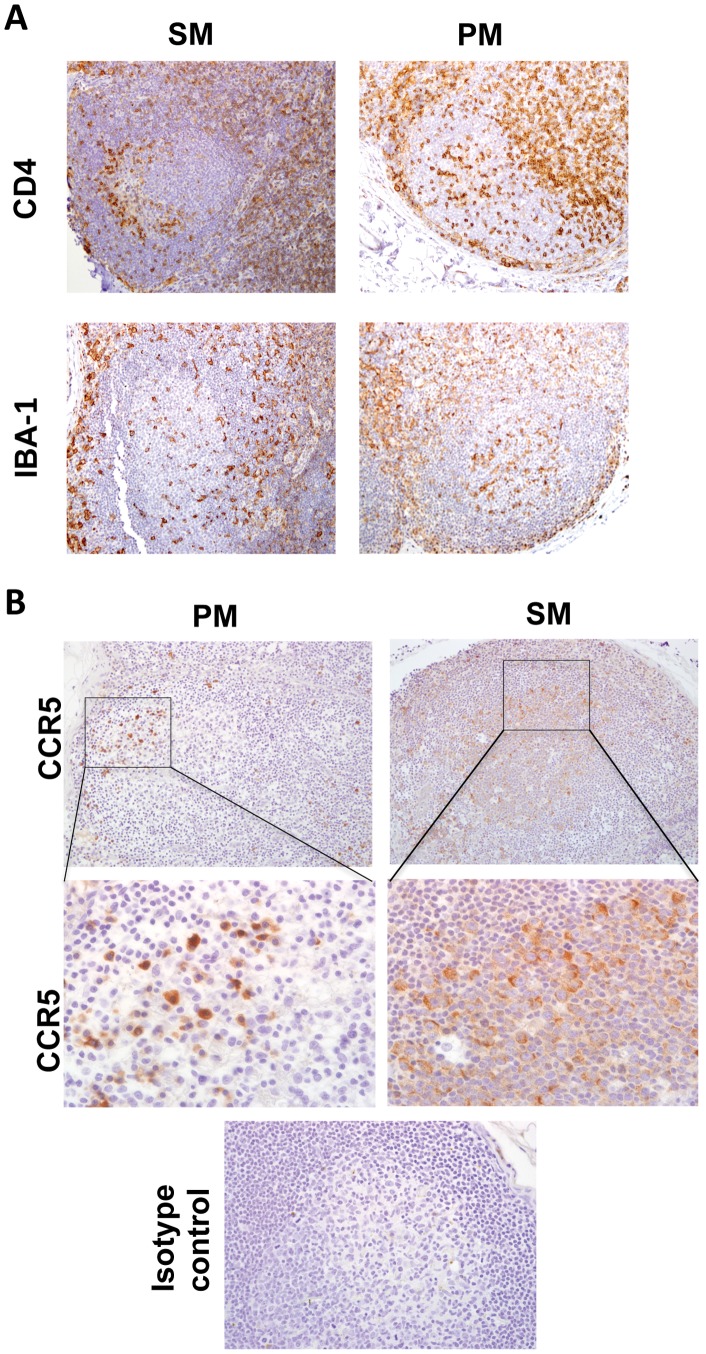
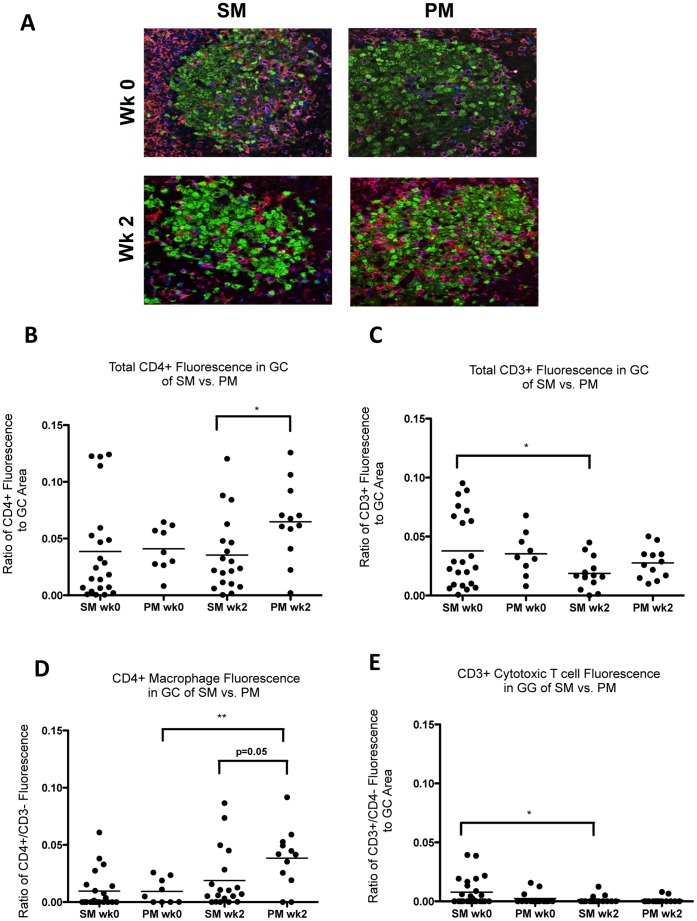
Lymphoid tissue immunopathology is a characteristic feature of chronic HIV/SIV infection in AIDS-susceptible species, but is absent in SIV-infected natural hosts. To investigate factors contributing to this difference, we compared germinal center development and SIV RNA distribution in peripheral lymph nodes during primary SIV infection of the natural host sooty mangabey and the non-natural host pig-tailed macaque. Although SIV-infected cells were detected in the lymph node of both species at two weeks post infection, they were confined to the lymph node paracortex in immune-competent mangabeys but were seen in both the paracortex and the germinal center of SIV-infected macaques. By six weeks post infection, SIV-infected cells were no longer detected in the lymph node of sooty mangabeys. The difference in localization and rate of disappearance of SIV-infected cells between the two species was associated with trapping of cell-free virus on follicular dendritic cells and higher numbers of germinal center CD4(+) T lymphocytes in macaques post SIV infection. Our data suggests that fundamental differences in the germinal center microenvironment prevent productive SIV infection within the lymph node germinal centers of natural hosts contributing to sustained immune competency.
Conflict of interest statement
Figures
Similar articles
-
Reduced Simian Immunodeficiency Virus Replication in Macrophages of Sooty Mangabeys Is Associated with Increased Expression of Host Restriction Factors.J Virol. 2015 Oct;89(20):10136-44. doi: 10.1128/JVI.00710-15. Epub 2015 Jul 22. J Virol. 2015. PMID: 26202248 Free PMC article.
-
Divergent host responses during primary simian immunodeficiency virus SIVsm infection of natural sooty mangabey and nonnatural rhesus macaque hosts.J Virol. 2005 Apr;79(7):4043-54. doi: 10.1128/JVI.79.7.4043-4054.2005. J Virol. 2005. PMID: 15767406 Free PMC article.
-
nef gene is required for robust productive infection by simian immunodeficiency virus of T-cell-rich paracortex in lymph nodes.J Virol. 2003 Apr;77(7):4169-80. doi: 10.1128/jvi.77.7.4169-4180.2003. J Virol. 2003. PMID: 12634375 Free PMC article.
-
Lessons learnt from studies of the immune characterization of naturally SIV infected sooty mangabeys.Front Biosci. 2003 Sep 1;8:s1030-50. doi: 10.2741/1180. Front Biosci. 2003. PMID: 12957849 Review.
-
A case for innate immune effector mechanisms as contributors to disease resistance in SIV-infected sooty mangabeys.Curr HIV Res. 2009 Jan;7(1):12-22. doi: 10.2174/157016209787048465. Curr HIV Res. 2009. PMID: 19149550 Review.
Cited by
-
Viremic non-progression in HIV/SIV infection: A tied game between virus and host.Cell Rep Med. 2025 Jan 21;6(1):101921. doi: 10.1016/j.xcrm.2024.101921. Cell Rep Med. 2025. PMID: 39842407 Free PMC article. Review.
-
Lymph Node Cellular and Viral Dynamics in Natural Hosts and Impact for HIV Cure Strategies.Front Immunol. 2018 Apr 19;9:780. doi: 10.3389/fimmu.2018.00780. eCollection 2018. Front Immunol. 2018. PMID: 29725327 Free PMC article. Review.
-
Follicular Dendritic Cells of Lymph Nodes as Human Immunodeficiency Virus/Simian Immunodeficiency Virus Reservoirs and Insights on Cervical Lymph Node.Front Immunol. 2018 Apr 19;9:805. doi: 10.3389/fimmu.2018.00805. eCollection 2018. Front Immunol. 2018. PMID: 29725333 Free PMC article. Review.
-
NK-B cell cross talk induces CXCR5 expression on natural killer cells.iScience. 2021 Sep 9;24(10):103109. doi: 10.1016/j.isci.2021.103109. eCollection 2021 Oct 22. iScience. 2021. PMID: 34622162 Free PMC article.
-
Natural killer cells migrate into and control simian immunodeficiency virus replication in lymph node follicles in African green monkeys.Nat Med. 2017 Nov;23(11):1277-1286. doi: 10.1038/nm.4421. Epub 2017 Oct 16. Nat Med. 2017. PMID: 29035370 Free PMC article.
References
-
- Hahn BH, Shaw GM, De Cock KM, Sharp PM (2000) AIDS as a zoonosis: scientific and public health implications. Science 287: 607–614. - PubMed
-
- Silvestri G, Sodora D, Koup RA, Paiardini M, O’Neil SP, et al. (2003) Nonpathogenic SIV infection of sooty mangabeys is characterized by limited bystander immunopathology despite chronic high-level viremia. Immunity 18: 441–452. - PubMed
Publication types
MeSH terms
Substances
Grants and funding
- R01-NS048831/NS/NINDS NIH HHS/United States
- P30 AI050409/AI/NIAID NIH HHS/United States
- P51 OD011132/OD/NIH HHS/United States
- R01 NS048831/NS/NINDS NIH HHS/United States
- P51 OD011103/OD/NIH HHS/United States
- P51 RR000165/RR/NCRR NIH HHS/United States
- AI084810/AI/NIAID NIH HHS/United States
- T32 AI007638/AI/NIAID NIH HHS/United States
- P51OD011132/OD/NIH HHS/United States
- AI049809/AI/NIAID NIH HHS/United States
- R01 AI049809/AI/NIAID NIH HHS/United States
- P51OD011103/OD/NIH HHS/United States
- R01 AI084810/AI/NIAID NIH HHS/United States
- RR000165/RR/NCRR NIH HHS/United States
- RR000168/RR/NCRR NIH HHS/United States
- P30 AI50409/AI/NIAID NIH HHS/United States
- P51 RR000168/RR/NCRR NIH HHS/United States
- K26 RR000168/RR/NCRR NIH HHS/United States
LinkOut - more resources
Full Text Sources
Other Literature Sources
Research Materials
