

T3_MM: a Markov model effectively classifies bacterial type III secretion signals
- PMID: 23472154
- PMCID: PMC3589343
- DOI: 10.1371/journal.pone.0058173
T3_MM: a Markov model effectively classifies bacterial type III secretion signals
Abstract
Motivation: Type III Secretion Systems (T3SSs) play important roles in the interaction between gram-negative bacteria and their hosts. T3SSs function by translocating a group of bacterial effector proteins into the host cytoplasm. The details of specific type III secretion process are yet to be clarified. This research focused on comparing the amino acid composition within the N-terminal 100 amino acids from type III secretion (T3S) signal sequences or non-T3S proteins, specifically whether each residue exerts a constraint on residues found in adjacent positions. We used these comparisons to set up a statistic model to quantitatively model and effectively distinguish T3S effectors.
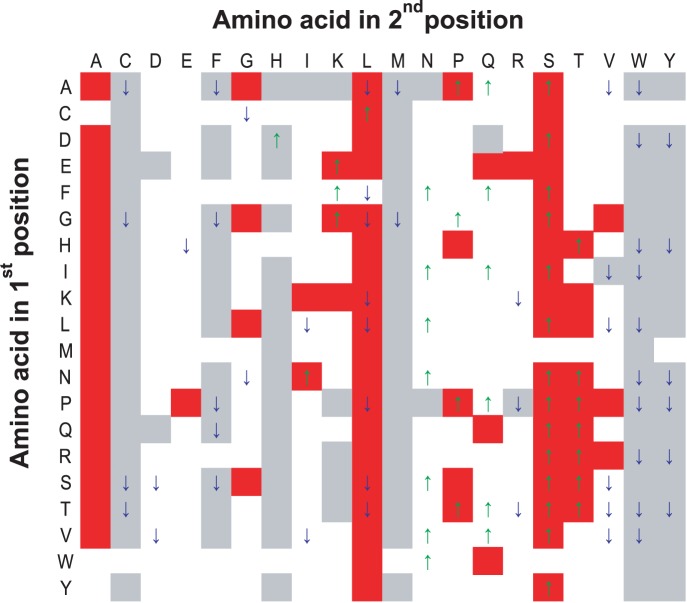
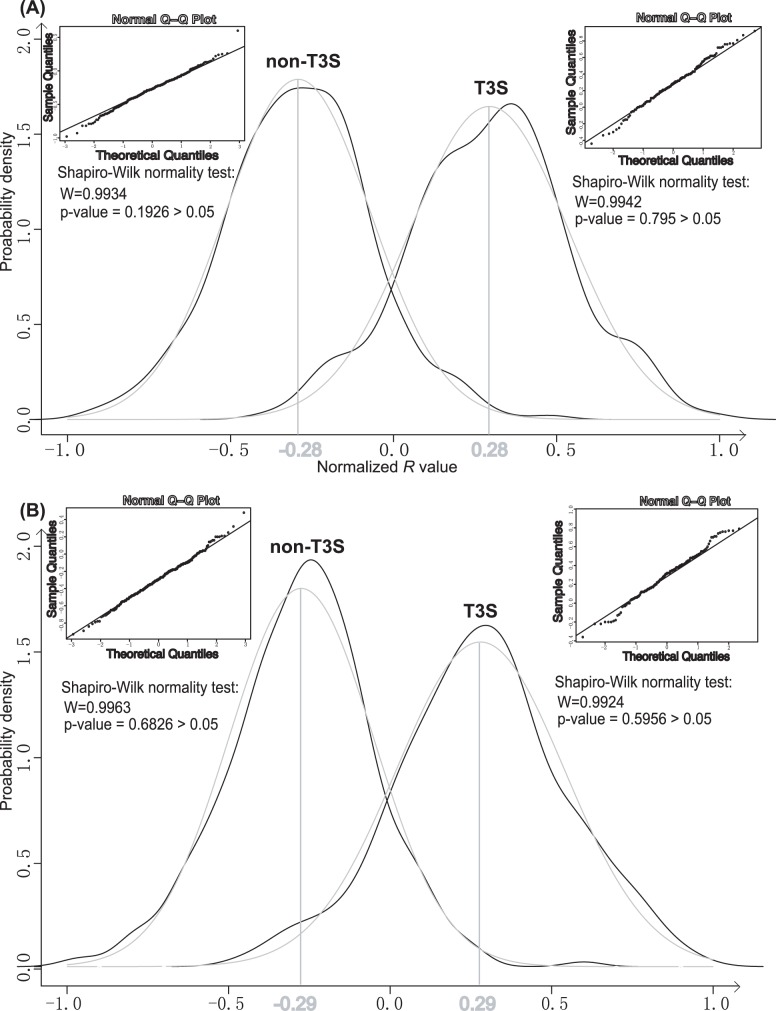
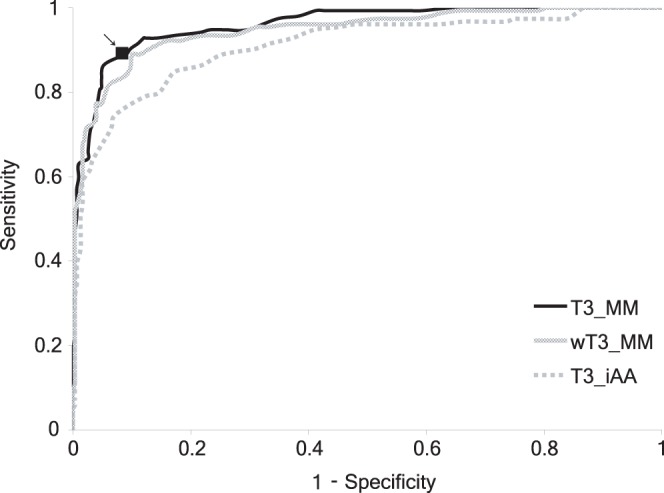
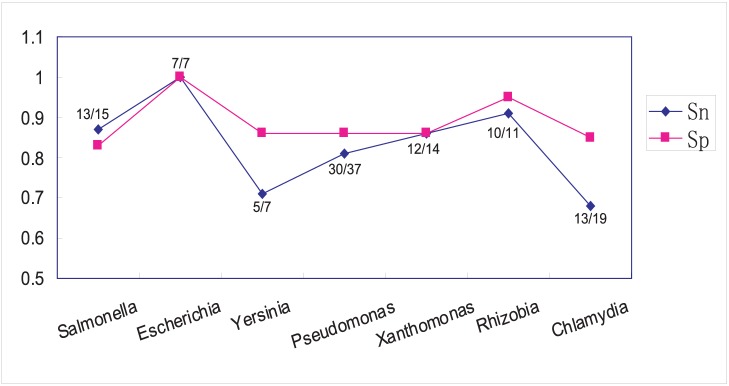
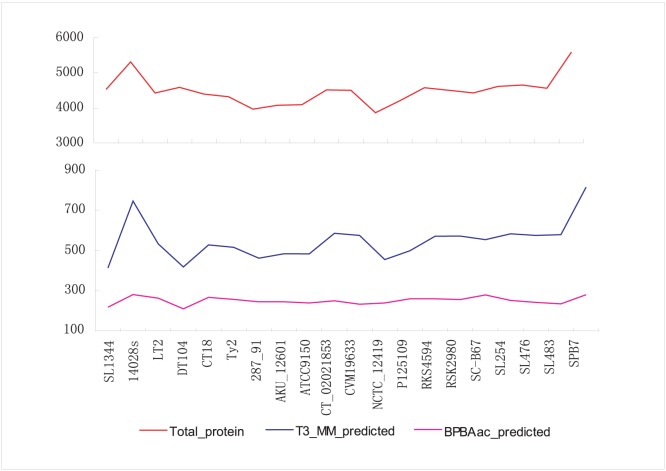
Results: In this study, the amino acid composition (Aac) probability profiles conditional on its sequentially preceding position and corresponding amino acids were compared between N-terminal sequences of T3S and non-T3S proteins. The profiles are generally different. A Markov model, namely T3_MM, was consequently designed to calculate the total Aac conditional probability difference, i.e., the likelihood ratio of a sequence being a T3S or a non-T3S protein. With T3_MM, known T3S and non-T3S proteins were found to well approximate two distinct normal distributions. The model could distinguish validated T3S and non-T3S proteins with a 5-fold cross-validation sensitivity of 83.9% at a specificity of 90.3%. T3_MM was also shown to be more robust, accurate, simple, and statistically quantitative, when compared with other T3S protein prediction models. The high effectiveness of T3_MM also indicated the overall Aac difference between N-termini of T3S and non-T3S proteins, and the constraint of Aac exerted by its preceding position and corresponding Aac.
Availability: An R package for T3_MM is freely downloadable from: http://biocomputer.bio.cuhk.edu.hk/softwares/T3_MM. T3_MM web server: http://biocomputer.bio.cuhk.edu.hk/T3DB/T3_MM.php.
Conflict of interest statement
Figures
Similar articles
-
High-accuracy prediction of bacterial type III secreted effectors based on position-specific amino acid composition profiles.Bioinformatics. 2011 Mar 15;27(6):777-84. doi: 10.1093/bioinformatics/btr021. Epub 2011 Jan 13. Bioinformatics. 2011. PMID: 21233168
-
Effective identification of Gram-negative bacterial type III secreted effectors using position-specific residue conservation profiles.PLoS One. 2013 Dec 31;8(12):e84439. doi: 10.1371/journal.pone.0084439. eCollection 2013. PLoS One. 2013. PMID: 24391954 Free PMC article.
-
Effective identification of bacterial type III secretion signals using joint element features.PLoS One. 2013 Apr 4;8(4):e59754. doi: 10.1371/journal.pone.0059754. Print 2013. PLoS One. 2013. PMID: 23593149 Free PMC article.
-
The Yersinia pestis type III secretion system: expression, assembly and role in the evasion of host defenses.Immunol Res. 2013 Dec;57(1-3):237-45. doi: 10.1007/s12026-013-8454-3. Immunol Res. 2013. PMID: 24198067 Review.
-
The bacterial injection kit: type III secretion systems.Ann Med. 2005;37(4):234-49. doi: 10.1080/07853890510037329. Ann Med. 2005. PMID: 16019722 Review.
Cited by
-
Prediction of bacterial type IV secreted effectors by C-terminal features.BMC Genomics. 2014 Jan 21;15:50. doi: 10.1186/1471-2164-15-50. BMC Genomics. 2014. PMID: 24447430 Free PMC article.
-
SecretEPDB: a comprehensive web-based resource for secreted effector proteins of the bacterial types III, IV and VI secretion systems.Sci Rep. 2017 Jan 23;7:41031. doi: 10.1038/srep41031. Sci Rep. 2017. PMID: 28112271 Free PMC article.
-
Computational prediction of secreted proteins in gram-negative bacteria.Comput Struct Biotechnol J. 2021 Mar 22;19:1806-1828. doi: 10.1016/j.csbj.2021.03.019. eCollection 2021. Comput Struct Biotechnol J. 2021. PMID: 33897982 Free PMC article. Review.
-
Comparative genomic analysis of clinical and environmental strains provides insight into the pathogenicity and evolution of Vibrio parahaemolyticus.BMC Genomics. 2014 Dec 18;15(1):1135. doi: 10.1186/1471-2164-15-1135. BMC Genomics. 2014. PMID: 25518728 Free PMC article.
-
GENESIS - The GENEric SImulation System for Modelling State Transitions.J Open Res Softw. 2017 Sep 20;5(1):24. doi: 10.5334/jors.179. J Open Res Softw. 2017. PMID: 28989704 Free PMC article.
References
-
- Enninga J, Rosenshine I (2009) Imaging the assembly, structure and activity of type III secretion systems.Cell Microbiol., 11, 1462–1470. - PubMed
-
- Izoré T, Job V, Dessen A (2011) Biogenesis, regulation, and targeting of the type III secretion system. Structure, 19, 603–12. - PubMed
-
- Lindeberg M, Collmer A (2009) Gene Ontology for type III effectors: capturing processes at the host-pathogen interface. Trends Microbiol., 17, 304–11. - PubMed
MeSH terms
Substances
LinkOut - more resources
Full Text Sources
Other Literature Sources
