. 2013;8(3):e58335.
doi: 10.1371/journal.pone.0058335. Epub 2013 Mar 5.

Orientations and proximities of the extracellular ends of transmembrane helices S0 and S4 in open and closed BK potassium channels

Affiliations

Orientations and proximities of the extracellular ends of transmembrane helices S0 and S4 in open and closed BK potassium channels

Xiaowei Niu et al. PLoS One. 2013.

Abstract

The large-conductance potassium channel (BK) α subunit contains a transmembrane (TM) helix S0 preceding the canonical TM helices S1 through S6. S0 lies between S4 and the TM2 helix of the regulatory β1 subunit. Pairs of Cys were substituted in the first helical turns in the membrane of BK α S0 and S4 and in β1 TM2. One such pair, W22C in S0 and W203C in S4, was 95% crosslinked endogenously. Under voltage-clamp conditions in outside-out patches, this crosslink was reduced by DTT and reoxidized by a membrane-impermeant bis-quaternary ammonium derivative of diamide. The rate constants for this reoxidation were not significantly different in the open and closed states of the channel. Thus, these two residues are approximately equally close in the two states. In addition, 90% crosslinking of a second pair, R20C in S0 and W203C in S4, had no effect on the V50 for opening. Taken together, these findings indicate that separation between residues at the extracellular ends of S0 and S4 is not required for voltage-sensor activation. On the contrary, even though W22C and W203C were equally likely to form a disulfide in the activated and deactivated states, relative immobilization by crosslinking of these two residues favored the activated state. Furthermore, the efficiency of recrosslinking of W22C and W203C on the cell surface was greater in the presence of the β1 subunit than in its absence, consistent with β1 acting through S0 to stabilize its immobilization relative to α S4.


Conflict of interest statement

Competing Interests: The authors have declared that no competing interests exist.

Figures

Figure 1
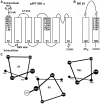
Figure 1. Membrane topology of BK α and β1 subunits.
(A) Mouse BK α residues mutated to Cys in the first two turns of S0 and S4. An HRV-3C protease cleavage site was inserted in the S0-S1 loop (box), the two native extracellular Cys, C14 and C141, were mutated to Ala, and a FLAG-epitope (MDYKDDDDKSPGDS) was added to its N-terminus. This construct is termed pWT1 α. (B) Mouse BK β1 residues mutated to Cys in the first two turns of TM2. (C) The residues at the extracellular ends of S0, S4, and TM2 in the membrane are represented as ideal αhelices, as viewed from the extracellular side. The relative positions and orientations of the helices optimize the average observed endogenous crosslinking between Cys.
Figure 2
Figure 2. Effects on V50 of endogenously formed S0-S4 disulfide bonds, their reduction, and their QPD-induced reformation at the cell surface.
(A, B) Macroscopic currents (insets) and normalized G-V curves of untreated cells expressing W22C/W203C (A) or W22C/G205C (B), after treatment with 10 mM DTT (pH 7.5) for 5 min, and after subsequent treatment with 40 μM QPD (pH 7.5) for 2 min. Recordings were from outside-out macropatches with 10 μM Ca2+ inside the pipette. At each potential, the mean relative conductance averaged from several cells is plotted. The mean G-V curve for pWT1 α is shown as a dashed-line. (C) Mean V50 ± SD of the V50s from the individual fits of the Boltzmann equation to the currents from each cell. The V50s were determined after endogenous disulfide crosslinking (black bars), after subsequent DTT (red bars), and finally after 40 μM QPD (green bars). The mean V50 for pWT1 α is shown as a dashed-line. In C, the macropatches were held at −100 mV (closed state) during the QPD-induced reoxidation. N = 3–11. (D) As C, except that the patches were held at +80 mV (open state) during the application of QPD. The mean V50 for pWT1 α is shown as a dashed-line. * P<0.05, **P<0.01, *** P<0.001, **** P< 0.0001 by one-way Anova followed by Tukey’s post-hoc analysis for multiple comparisons between brackets. Without brackets, comparison to pWT1 αby one-way Anova followed by Tukey’s post-hoc analysis.
Figure 3
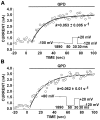
Figure 3. Kinetics of reformation of disulfide bond between W22C and W203C in the closed state (A) and in the open state (B).
Outside-out patches were bathed in 10 mM DTT (pH 7.5) for 5 min. During the subsequent application of 40 μM QPD, membrane potential was held for 1890 ms at either −100 mV (A) or +80 mV (B). After 50 ms at −120 mV, the patch was depolarized to +20 mV for 30 ms and hyperpolarized to −120 mV for 30 ms, during which the tail current was recorded. This cycle, represented in the insets, was repeated every 2 s. The peak amplitudes of the tail currents are plotted against elapsed time. The data were fit with a single exponential function. The means of the rate constants from the least-squares fits of 5 independent experiments are given under the curves. The pipette solution contained 10 μM Ca2+. N =  4 for closed state and n = 5 for open state. P =  not significant by unpaired Student’s t-test.
Figure 4
Figure 4. Extents of disulfide bond formation between Cys in S0 and Cys in S4
. (A–C) Cells were transfected with the indicated double-Cys-mutant BK α. After 2 days, the cells were collected, and biotinylated with the impermeant sulfo-NHS-biotin. The cells were divided and were either not further treated, treated with 10 mM DTT, or treated with 10 mM DTT and 40 μM QPD. The conditions were the same as in Fig. 2. Cells were lysed. Solubilized BK α was captured on Neutravidin beads, cleaved with HRV-3c protease between S0 and S1, electrophoresed, and immuno-blotted with an anti-BK α-C-terminal-epitope antibody. The extents of crosslinking were calculated from the relative integrated densities of the full-length α band and the truncated (Frag) α band, corrected by the efficiency of HRV-3c cleavage, determined individually for each Cys pair in each experiment (not shown). The efficiencies of cleavage were approximately 70%. N = 2–4. Mean + SD. N = 2–4 experiments, each with duplicate determinations. * P<0.05, **P<0.01, *** P<0.001, ****, P< 0.0001 by one-way Anova followed by Tukey’s post-hoc analysis.
Figure 5
Figure 5. Disulfide bond formation between R20C flanking S0 and W203C in S4.
(A) Intact cells transfected with BK αR20C/W203C were treated and analyzed as in Fig. 4. The extents of crosslinking, corrected for the efficiencies of HRV-3C cleavage, are shown below the blots. N = 2. (B) Normalized G-V curves of R20C/W203C either untreated (black), after 10 mM DTT for 5 min (red), after DTT and 40 μM QPD for 2 min, applied in the closed state (filled green diamond), or after DTT and QPD applied in the open state (open green diamond). Fits of a Boltzmann equation were to the means and SD of normalized conductances from separate patches. The dashed line indicates the G-V curve of pWT1 α channels. The pipette solution contained 10 μM Ca2+. N = 3–6.
Figure 6
Figure 6. Competition between W203C in S4 and L157C in TM2 for crosslinking to W22C in S0.
(A) Cells were transfected with indicated α and β1 subunit mutants. In A, the extent of formation of disulfide-crosslinked α and β1 was determined. In B and C, the extent of formation of an intra-α-subunit disulfide between S0 and S4 was determined. In all cases, three conditions as described in Fig. 4 were analyzed: untreated, reduced with DTT, and reduced with DTT and reoxidized with QPD. Mean + s.e.m. N = 3. **P = 0.01, paired Student’s t test.
Figure 7
Figure 7. Effects of the mutations W22C in S0, W203C in S4, and L157C in TM2, singly and in combination, on BK channel function.
(A) Normalized G-V curves. The data for the combinations of α and β1 are shown as individual points. The data for α alone are shown as fitted curves. (B) V50 as a function of [Ca2+]IN for various combinations. (C) TauACTIVATION and (D) TauDEACTIVATION for various combinations of pWT1 α or mutant α and β1 or β1 L157C or without β1. Errors are SEM. N = 3–9.

Similar articles

Cited by

References

    1. Barrett JN, Magleby KL, Pallotta BS (1982) Properties of single calcium-activated potassium channels in cultured rat muscle. J Physiol 331: 211–230. - PMC - PubMed
    1. Marty A (1981) Ca-dependent K channels with large unitary conductance in chromaffin cell membranes. Nature 291: 497–500. - PubMed
    1. Pallotta BS, Magleby KL, Barrett JN (1981) Single channel recordings of Ca2+-activated K+ currents in rat muscle cell culture. Nature 293: 471–474. - PubMed
    1. Wallner M, Meera P, Toro L (1996) Determinant for beta-subunit regulation in high-conductance voltage-activated and Ca(2+)-sensitive K+ channels: an additional transmembrane region at the N terminus. Proc Natl Acad Sci U S A 93: 14922–14927. - PMC - PubMed
    1. Adelman JP, Shen KZ, Kavanaugh MP, Warren RA, Wu YN, et al. (1992) Calcium-activated potassium channels expressed from cloned complementary DNAs. Neuron 9: 209–216. - PubMed

Publication types

LinkOut - more resources