

Codon optimization significantly improves the expression level of a keratinase gene in Pichia pastoris
- PMID: 23472192
- PMCID: PMC3589435
- DOI: 10.1371/journal.pone.0058393
Codon optimization significantly improves the expression level of a keratinase gene in Pichia pastoris
Abstract
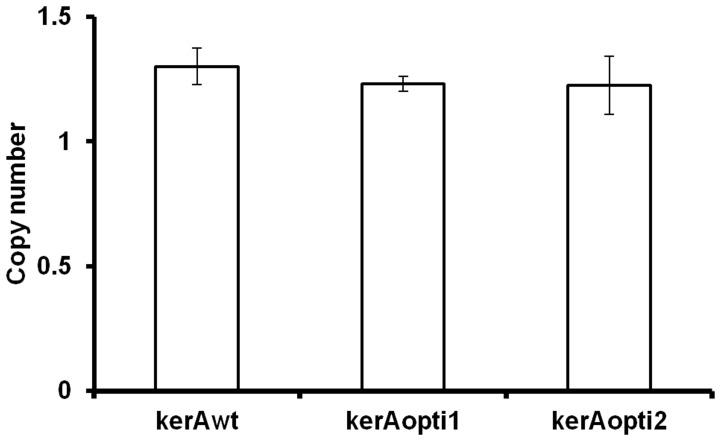
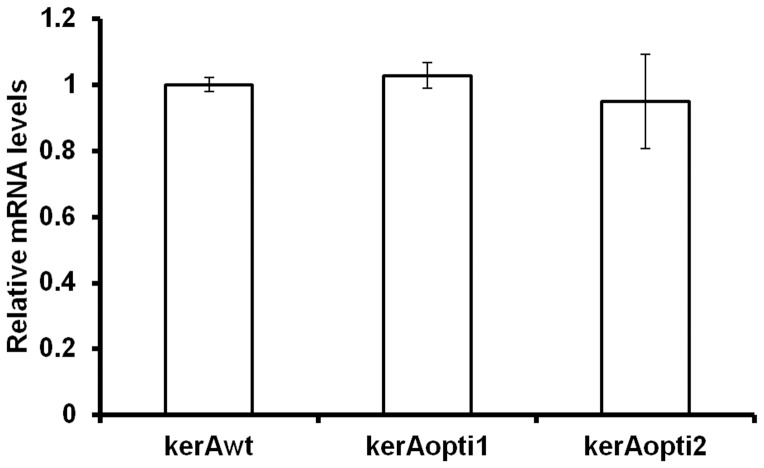
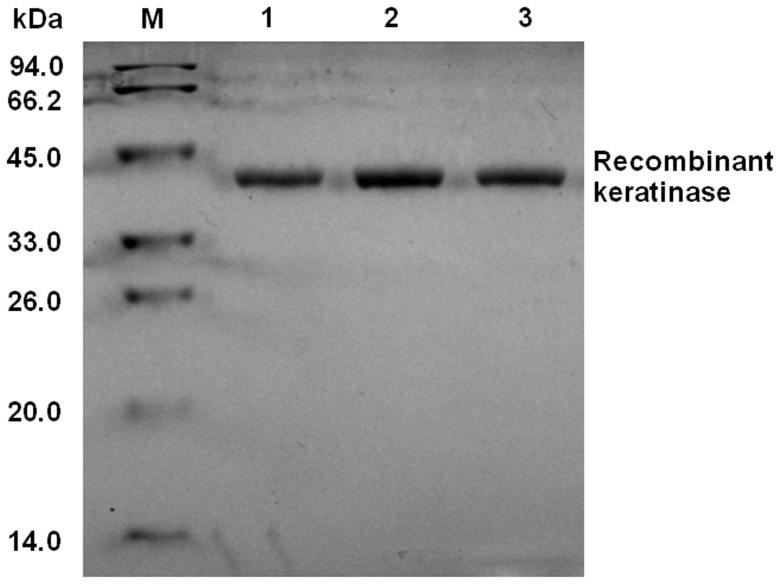
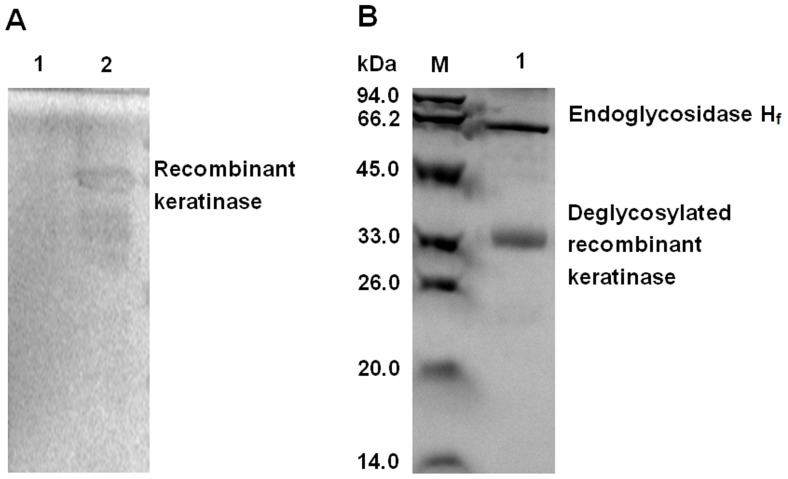
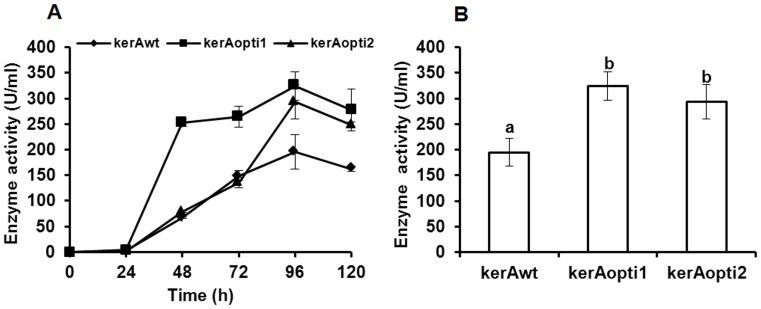
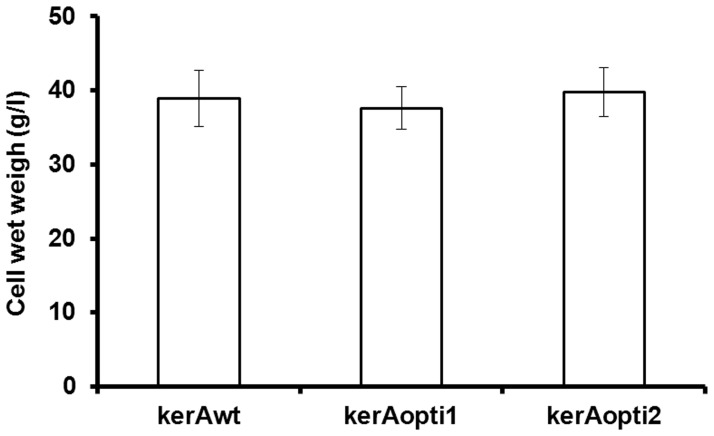
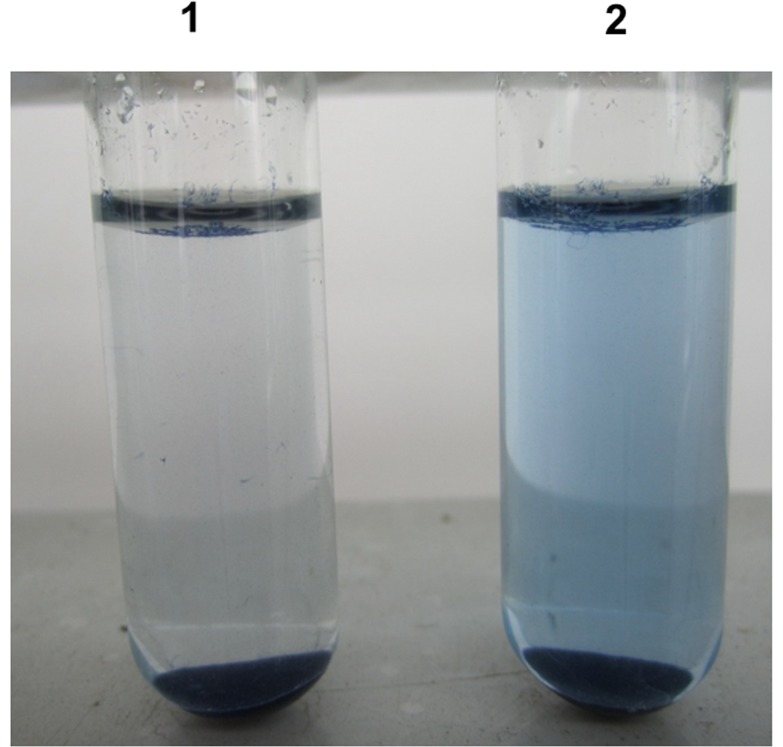
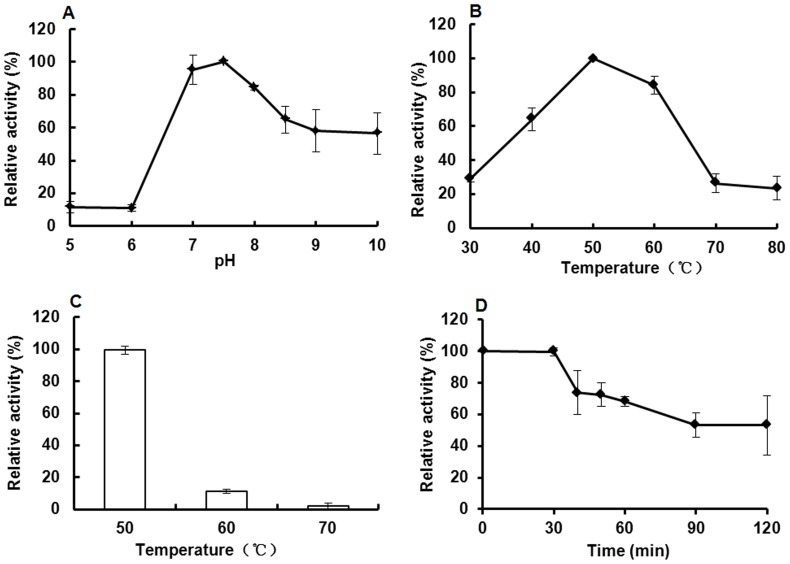
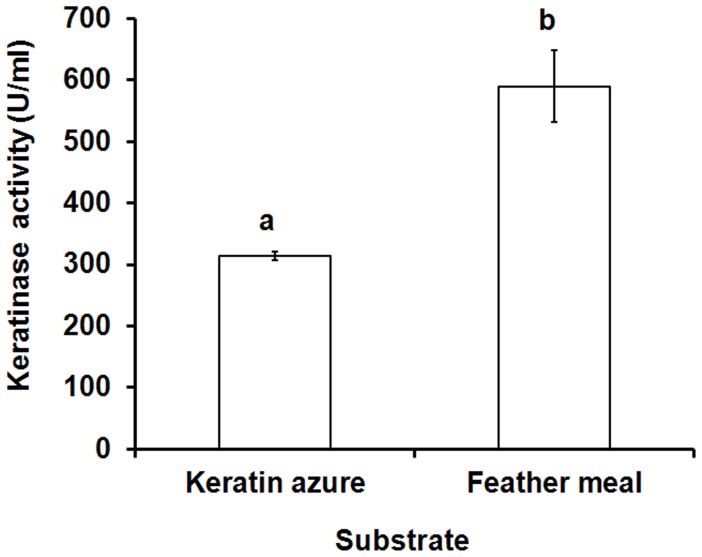
The main keratinase (kerA) gene from the Bacillus licheniformis S90 was optimized by two codon optimization strategies and expressed in Pichia pastoris in order to improve the enzyme production compared to the preparations with the native kerA gene. The results showed that the corresponding mutations (synonymous codons) according to the codon bias in Pichia pastoris were successfully introduced into keratinase gene. The highest keratinase activity produced by P. pastoris pPICZαA-kerAwt, pPICZαA-kerAopti1 and pPICZαA-kerAopti2 was 195 U/ml, 324 U/ml and 293 U/ml respectively. In addition, there was no significant difference in biomass concentration, target gene copy numbers and relative mRNA expression levels of every positive strain. The molecular weight of keratinase secreted by recombinant P. pastori was approx. 39 kDa. It was optimally active at pH 7.5 and 50°C. The recombinant keratinase could efficiently degrade both α-keratin (keratin azure) and β-keratin (chicken feather meal). These properties make the P. pastoris pPICZαA-kerAopti1 a suitable candidate for industrial production of keratinases.
Conflict of interest statement
Figures
Similar articles
-
Purification and characterization of keratinase from recombinant Pichia and Bacillus strains.Protein Expr Purif. 2009 Mar;64(1):24-31. doi: 10.1016/j.pep.2008.10.008. Epub 2008 Oct 25. Protein Expr Purif. 2009. PMID: 18996485
-
Comparative analysis of bacterial expression systems for keratinase production.Appl Biochem Biotechnol. 2014 Jul;173(5):1222-35. doi: 10.1007/s12010-014-0925-z. Epub 2014 May 1. Appl Biochem Biotechnol. 2014. PMID: 24781981
-
Molecular strategies to increase keratinase production in heterologous expression systems for industrial applications.Appl Microbiol Biotechnol. 2021 May;105(10):3955-3969. doi: 10.1007/s00253-021-11321-y. Epub 2021 May 3. Appl Microbiol Biotechnol. 2021. PMID: 33937928 Review.
-
Expression of a keratinase (kerA) gene from Bacillus licheniformis in Escherichia coli and characterization of the recombinant enzymes.Biotechnol Lett. 2013 Feb;35(2):239-44. doi: 10.1007/s10529-012-1064-7. Epub 2012 Oct 18. Biotechnol Lett. 2013. PMID: 23076364
-
Research progress on the degradation mechanism and modification of keratinase.Appl Microbiol Biotechnol. 2023 Feb;107(4):1003-1017. doi: 10.1007/s00253-023-12360-3. Epub 2023 Jan 12. Appl Microbiol Biotechnol. 2023. PMID: 36633625 Review.
Cited by
-
Cloning and expression of a thermostable keratinase gene from Thermoactinomyces sp. YT06 in Escherichia coli and characterization of purified recombinant enzymes.World J Microbiol Biotechnol. 2019 Aug 20;35(9):135. doi: 10.1007/s11274-019-2710-1. World J Microbiol Biotechnol. 2019. PMID: 31432264
-
A novel feather-degrading bacterial isolate Geobacillus thermodenitrificans PS41 isolated from poultry farm soil.Arch Microbiol. 2022 Aug 18;204(9):565. doi: 10.1007/s00203-022-03179-z. Arch Microbiol. 2022. PMID: 35982264
-
Recent Advances in the Metabolic Engineering of Yeasts for Ginsenoside Biosynthesis.Front Bioeng Biotechnol. 2020 Feb 25;8:139. doi: 10.3389/fbioe.2020.00139. eCollection 2020. Front Bioeng Biotechnol. 2020. PMID: 32158753 Free PMC article. Review.
-
Gene and protein sequence optimization for high-level production of fully active and aglycosylated lysostaphin in Pichia pastoris.Appl Environ Microbiol. 2014 May;80(9):2746-53. doi: 10.1128/AEM.03914-13. Epub 2014 Feb 21. Appl Environ Microbiol. 2014. PMID: 24561590 Free PMC article.
-
Efficient Multi-Enzymes Immobilized on Porous Microspheres for Producing Inositol From Starch.Front Bioeng Biotechnol. 2020 May 5;8:380. doi: 10.3389/fbioe.2020.00380. eCollection 2020. Front Bioeng Biotechnol. 2020. PMID: 32478043 Free PMC article.
References
-
- Son HJ, Park HC, Kim HS, Lee CY (2008) Nutritional regulation of keratinolytic activity in Bacillus pumilis . Biotechnol Lett 30: 461–465. - PubMed
-
- Gupta R, Ramnani P (2006) Microbial keratinases and their prospective applications: an overview. Appl Microbiol Biotechnol 70: 21–33. - PubMed
-
- Langeveld JP, Wang JJ, Van de Wiel DF, Shih GC, Garssen GJ, et al. (2003) Enzymatic degradation of prion protein in brain stem from infected cattle and sheep. J Infect Dis 188 (11): 1782–1789. - PubMed
Publication types
MeSH terms
Substances
LinkOut - more resources
Full Text Sources
Other Literature Sources
