. 2013;8(3):e58425.
doi: 10.1371/journal.pone.0058425. Epub 2013 Mar 5.

Lysophosphatidylinositol-acyltransferase-1 (LPIAT1) is required to maintain physiological levels of PtdIns and PtdInsP(2) in the mouse

Affiliations

Lysophosphatidylinositol-acyltransferase-1 (LPIAT1) is required to maintain physiological levels of PtdIns and PtdInsP(2) in the mouse

Karen E Anderson et al. PLoS One. 2013.

Abstract

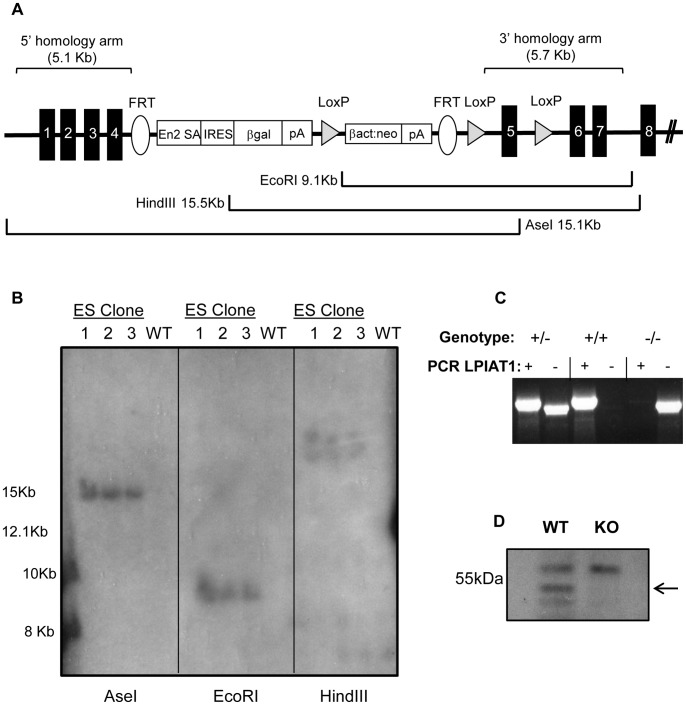
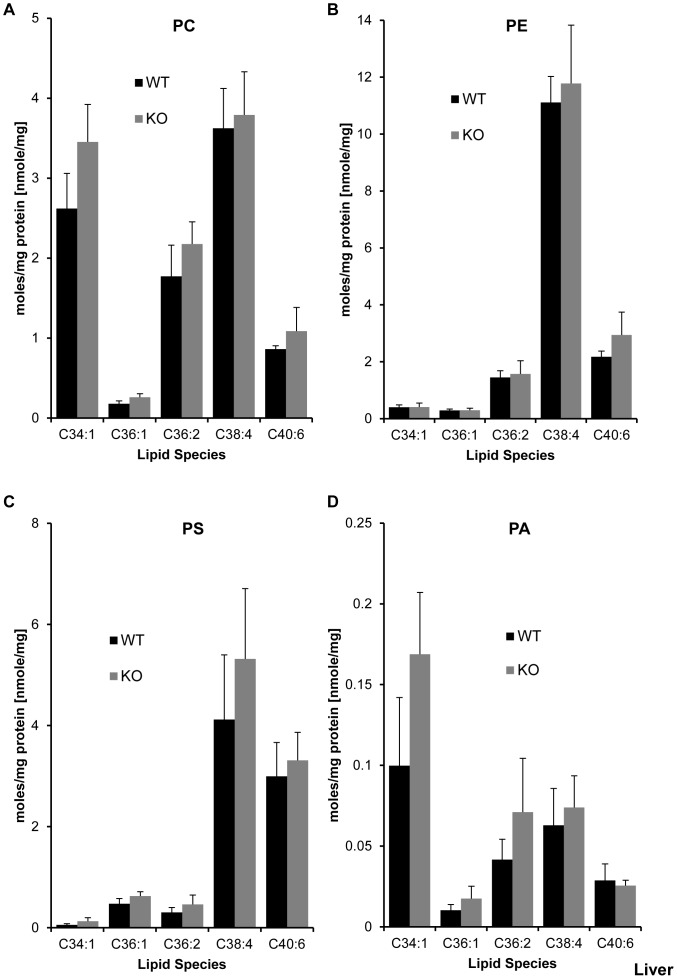
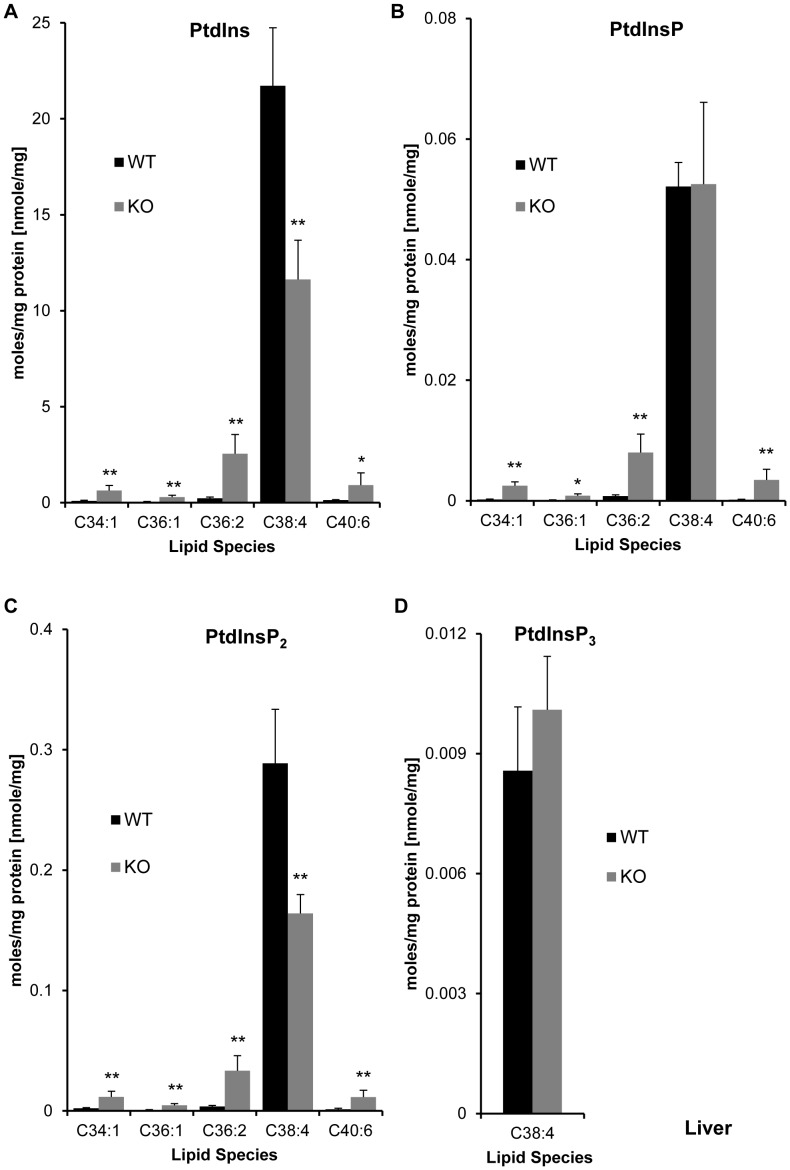
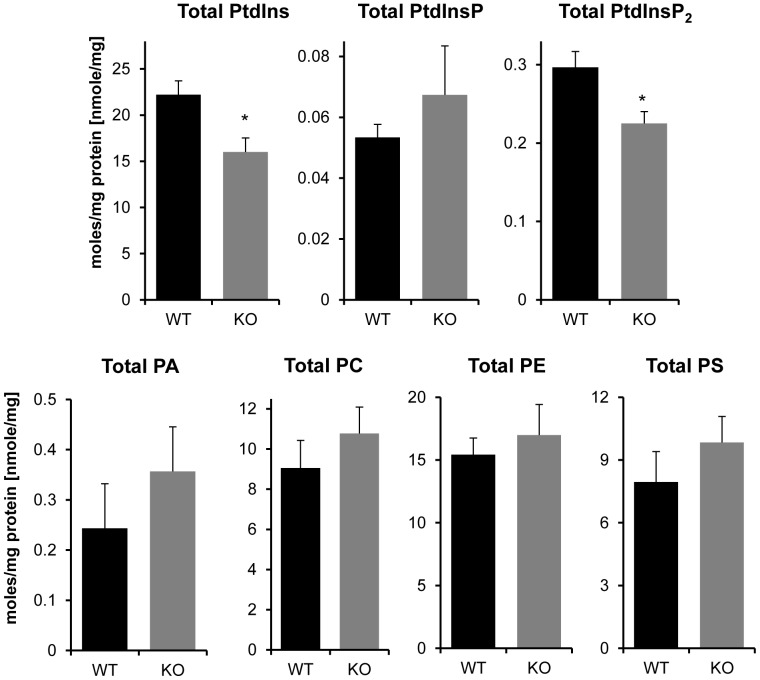
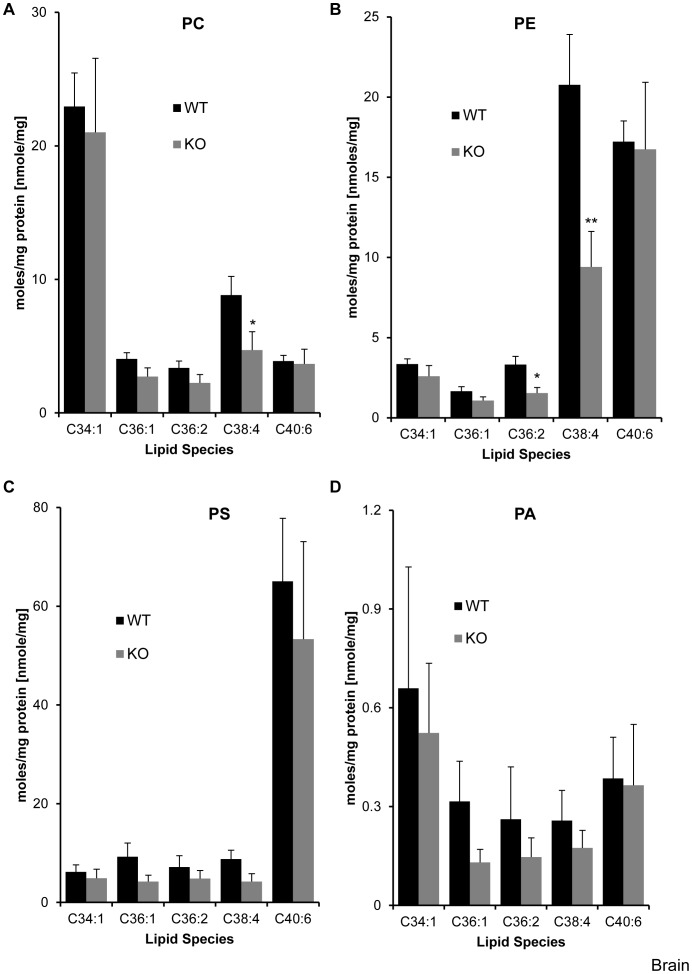
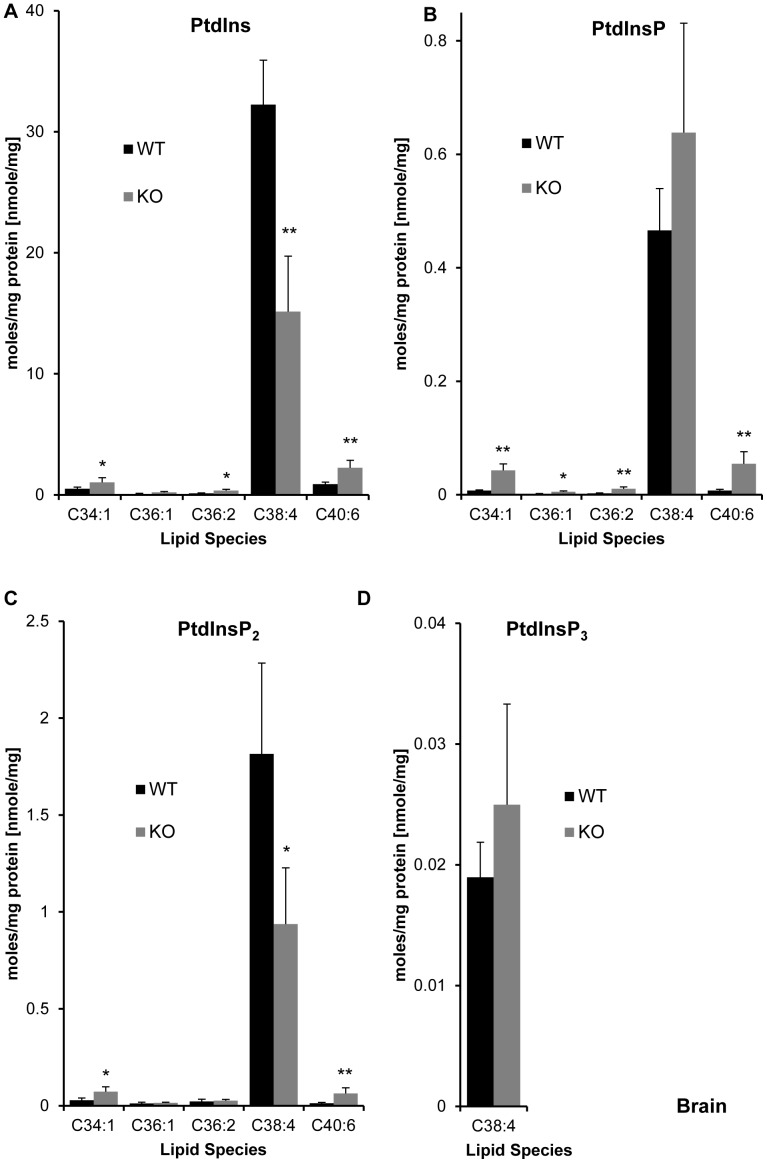
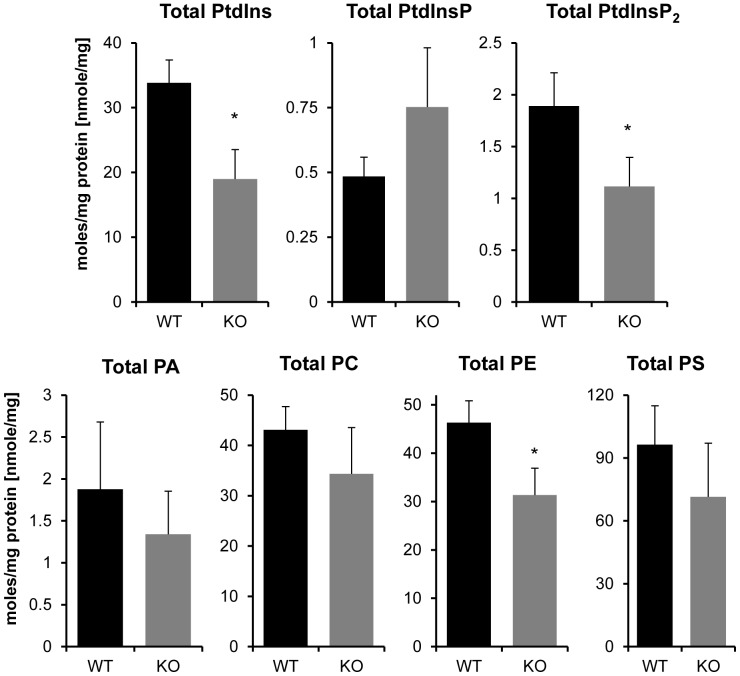
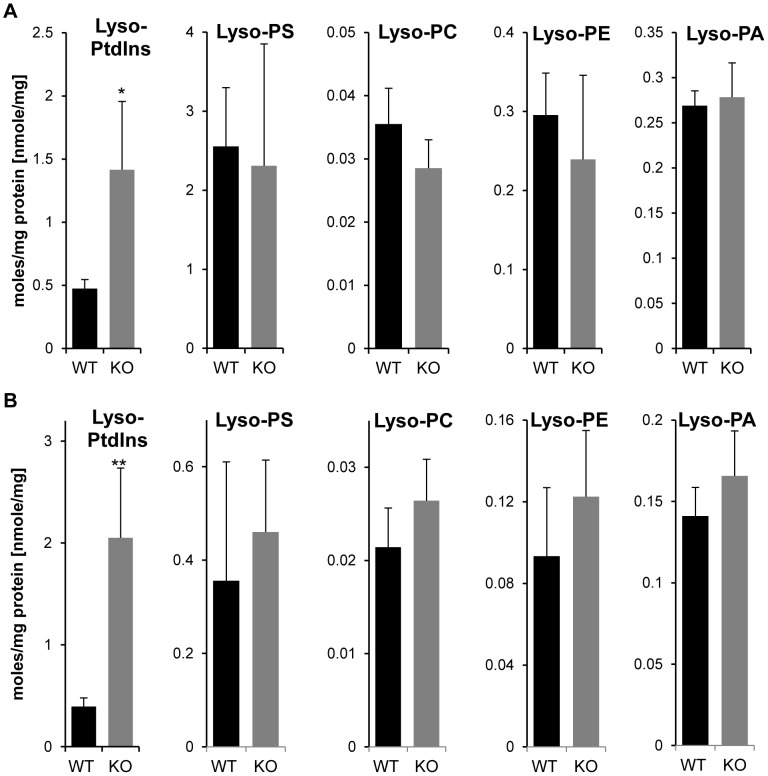
We disrupted the gene encoding lysophosphatidylinositol-acyltransferase-1 (LPIAT1) in the mouse with the aim of understanding its role in determining cellular phosphoinositide content. LPIAT1(-/-) mice were born at lower than Mendelian ratios and exhibited a severe developmental brain defect. We compared the phospholipid content of livers and brains from LPIAT1(-/-) and LPIAT1(+/+) littermates by LC-ESI/MS. In accord with previous studies, the most abundant molecular species of each phosphoinositide class (PtdIns, PtdInsP, PtdInsP2 and PtdInsP3) possessed a C38∶4 complement of fatty-acyl esters (C18∶0 and C20∶4 are usually assigned to the sn-1 and sn-2 positions, respectively). LPIAT1(-/-) liver and brain contained relatively less of the C38∶4 species of PtdIns, PtdInsP and PtdInsP2 (dropping from 95-97% to 75-85% of the total species measured for each lipid class) and relatively more of the less abundant species (PtdInsP3 less abundant species were below our quantification levels). The increases in the less abundant PtdIns and PtdInsP2 species did not compensate for the loss in C38∶4 species, resulting in a 26-44% reduction in total PtdIns and PtdInsP2 levels in both brain and liver. LPIAT1(-/-) brain and liver also contained increased levels of C18∶0 lyso-PtdIns (300% and 525% respectively) indicating a defect in the reacylation of this molecule. LPIAT1(-/-) brain additionally contained significantly reduced C38∶4 PC and PE levels (by 47% and 55% respectively), possibly contributing to the phenotype in this organ. The levels of all other molecular species of PC, PE, PS and PA measured in the brain and liver were very similar between LPIAT1(-/-) and LPIAT1(+/+) samples. These results suggest LPIAT1 activity plays a non-redundant role in maintaining physiological levels of PtdIns within an active deacylation/reacylation cycle in mouse tissues. They also suggest that this pathway must act in concert with other, as yet unidentified, mechanisms to achieve the enrichment observed in C38∶4 molecular species of phosphoinositides.


Conflict of interest statement

Competing Interests: The authors would like to declare that affiliations of two of the authors (AK and JC) to Babraham Bioscience Technologies Ltd. This affiliation does not alter the authors' adherence to all the PLOS ONE policies on sharing data and materials.

Figures

Figure 1
Figure 1. Generation of LPIAT1 knockout first mice.
(A) Schematic representation of LPIATtm1a(KOMP)Wtsi gene targeting vector, constructed by the High throughput gene targeting group at the Sanger Center as a ‘knock-out first’ allele that abrogates expression of the targeted allele. Shown are expected enzymatic digest fragments for EcoRI, HindIII and AseI digests of the correctly targeted allele, which were confirmed by Southern analysis of three ES cell clones and WT BL6 genomic DNA control using a [32P]-oligonucleotide probe to a 600bp region of the Neomycin gene within the targeting cassette (B). (C) Genotyping of mice was performed by PCR amplification to identify the presence of LPIAT1 WT allele (+) and/or targeted KO allele (−) from LPIAT1+/−, LPIAT1+/+ and LPIAT1−/− mice. (D) Western blot analysis was performed on 50 µg wet weight brain tissue from three pairs of LPIAT1+/+ (WT) and LPIAT1−/− (KO) 13 day old littermates as described in Materials and Methods. Shown is a representative immunoblot, with the arrow indicating the position of LPIAT1 protein.
Figure 2
Figure 2. Effect of LPIAT1 knockout on liver phospholipid molecular species.
Livers from 13 day old littermates expressing (LPIAT1+/+ (WT)) or lacking (LPIAT1−/− (KO)) LPIAT1 were homogenized and lipids extracted from 0.5 mg wet weight as described in Materials and Methods. Targeted molecular species of PC (A), PE (B), PS (C) and PA (D) were detected by MRM mass spectrometric analysis as described in Materials and Methods. Data are expressed as moles/mg protein, normalized to relevant internal standards. Shown are mean ± SD, n = 4 for both WT and KO. Data were analyzed by T-test.
Figure 3
Figure 3. Effect of LPIAT1 knockout on liver phosphoinositide lipid molecular species.
Livers from 13 day old littermates expressing (LPIAT1+/+ (WT)) or lacking (LPIAT1−/− (KO)) LPIAT1 were homogenized and lipids extracted from 0.5 mg wet weight as described in Materials and Methods. Targeted molecular species of PtdIns (A), PtdInsP (B), PtdInsP2 (C) and PtdInsP3 (D) were detected by MRM mass spectrometric analysis as described in Materials and Methods. Data are expressed as moles/mg protein, normalized to relevant internal standards. Shown are mean ± SD, n = 4 for both WT and KO. Data were analyzed by T-test. *p≤0.05, **p≤0.005.
Figure 4
Figure 4. Effect of LPIAT1 knockout on total levels of liver phospholipids and phosphoinositides.
Quantitated targeted molecular species of phosphoinositides PtdIns, PtdInsP and PtdInsP2 in LPIAT1+/+ (WT) or LPIAT1−/− (KO) liver samples presented in Figure 3, and phospholipids PA,PC,PE and PS from Figure 2 were added to calculate total levels for each lipid. Data are mean ± SD, n = 4 for both WT and KO. *p≤0.05, T-test.
Figure 5
Figure 5. Effect of LPIAT1 knockout on brain phospholipid molecular species.
Brains from 13 day old littermates expressing (LPIAT1+/+ (WT)) or lacking (LPIAT1−/− (KO)) LPIAT1 were homogenized and lipids extracted from 0.5 mg wet weight as described in Materials and Methods. Targeted molecular species of PC (A), PE (B), PS (C) and PA (D) were detected by MRM mass spectrometric analysis as described in Materials and Methods. Data are expressed as moles/mg protein, normalized to relevant internal standards. Shown are mean ± SD, n = 4 for both WT and KO. Data were analyzed by T-test. *p≤0.05, **p≤0.005.
Figure 6
Figure 6. Effect of LPIAT1 knockout on brain phosphoinositide lipid molecular species.
Brains from 13 day old littermates expressing (LPIAT1+/+ (WT)) or lacking (LPIAT1−/− (KO)) LPIAT1 were homogenised and lipid extracted from 0.5 mg wet weight as described in Materials and Methods. Targeted molecular species of PtdIns (A), PtdInsP (B), PtdInsP2 (C) and PtdInsP3 (D) were detected by MRM mass spectrometric analysis as described in Materials and Methods. Data are expressed as moles/mg protein, normalized to relevant internal standards. Shown are mean ± SD, n = 4 for both WT and KO. Data were analyzed by T-test. *p≤0.05, **p≤0.005.
Figure 7
Figure 7. Effect of LPIAT1 knockout on total levels of brain phospholipids and phosphoinositides.
Quantitated targetted molecular species of phosphoinositides PtdIns, PtdInsP and PtdInsP2 in LPIAT1+/+ (WT) or LPIAT1−/− (KO) brain samples presented in Figure 6, and phospholipids PA,PC,PE and PS from Figure 5 were added to calculate total levels for each lipid. Data are mean ± SD, n = 4 for both WT and KO. *p≤0.05, **p≤0.005, T-test.
Figure 8
Figure 8. Effect of LPIAT1 knockout on brain and liver lyso-phospholipid molecular species.
Brains (A) or livers (B) from 13 day old littermates expressing (LPIAT1+/+ (WT)) or lacking (LPIAT1−/− (KO)) LPIAT1 were ground, homogenized and lipids extracted from 0.5 mg wet weight as described in Materials and Methods. Lyso-phospholipids were targeted and were detected by MRM mass spectrometric anaylsis as described in Materials and Methods. Data are expressed as moles/mg protein, normalized to relevant internal standards. Shown are mean ± SD, n = 4 for both WT and KO. Data were analyzed by T-test. *p≤0.05, **p≤0.005.

References

    1. van Meer G, Voelker DR, Feigenson GW (2008) Membrane lipids: where they are and how they behave. Nat Rev Mol Cell Biol 9: 112–124. - PMC - PubMed
    1. Shindou H, Hishikawa D, Harayama T, Yuki K, Shimizu T (2009) Recent progress on acyl CoA: lysophospholipid acyltransferase research. J Lipid Res 50 Suppl: S46–51 - PMC - PubMed
    1. Kudo I, Murakami M (2002) Phospholipase A2 enzymes. Prostaglandins Other Lipid Mediat 68–69: 3–58. - PubMed
    1. Clark J, Anderson KE, Juvin V, Smith TS, Karpe F, et al. (2011) Quantification of PtdInsP3 molecular species in cells and tissues by mass spectrometry. Nat Methods 8: 267–272. - PMC - PubMed
    1. Lee HC, Inoue T, Sasaki J, Kubo T, Matsuda S, et al. (2012) LPIAT1 regulates arachidonic acid content in phosphatidylinositol and is required for cortical lamination in mice. Mol Biol Cell 23: 4689–4700. - PMC - PubMed

Publication types

Substances