. 2013 Mar 7;12(3):304-15.
doi: 10.1016/j.stem.2013.01.007.

Sox2 cooperates with inflammation-mediated Stat3 activation in the malignant transformation of foregut basal progenitor cells

Affiliations

Sox2 cooperates with inflammation-mediated Stat3 activation in the malignant transformation of foregut basal progenitor cells

Kuancan Liu et al. Cell Stem Cell. .

Abstract

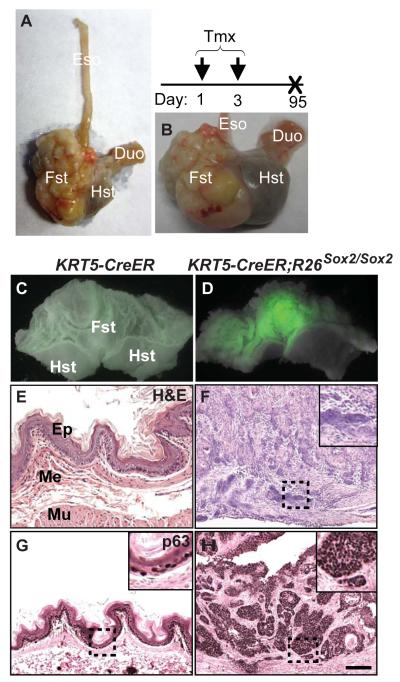
Sox2 regulates the self-renewal of multiple types of stem cells. Recent studies suggest it also plays oncogenic roles in the formation of squamous carcinoma in several organs, including the esophagus where Sox2 is predominantly expressed in the basal progenitor cells of the stratified epithelium. Here, we use mouse genetic models to reveal a mechanism by which Sox2 cooperates with microenvironmental signals to malignantly transform epithelial progenitor cells. Conditional overexpression of Sox2 in basal cells expands the progenitor population in both the esophagus and forestomach. Significantly, carcinoma only develops in the forestomach, where pathological progression correlates with inflammation and nuclear localization of Stat3 in progenitor cells. Importantly, co-overexpression of Sox2 and activated Stat3 (Stat3C) also transforms esophageal basal cells but not the differentiated suprabasal cells. These findings indicate that basal stem/progenitor cells are the cells of origin of squamous carcinoma and that cooperation between Sox2 and microenvironment-activated Stat3 is required for Sox2-driven tumorigenesis.


Figures

Figure 1
Figure 1. Sox2 Positive Basal Progenitor Cells Self-renew and Differentiate in vitro and in vivo
(A) Sox2 and Loricrin are expressed in the basal and suprabasal layers of the stratified epithelium, respectively. Nuclei are counterstained with DAPI. (B) Krt5 and p63 are also expressed in the basal cells. (C) Proliferating (Ki67+) cells are limited to the basal layer, labeled by p75 (nerve growth factor receptor). (D) Isolated basal progenitor cells proliferate to form colonies and maintain the expression of Sox2. (E) Schematic of the 3-D culture system in which single p75 positive basal cells are embedded and grown in matrix. (F) Single basal cells proliferate to form esophageospheres and maintain high levels of Sox2 expression in serum-free medium after being cultured for 8days. (G) Cells inside the sphere differentiate into squamous epithelium (Loricrin+) in the presence of 5% fetal bovine serum. (H) A single low dose of Tamoxifen (0.1mg/g body weight) labels individual cells in the basal layer of the KRT5-CreER;Rosa26-lacZ esophagus 14hrs after injection (left panel). Labeled basal cells divide and remain in basal layer (middle panel) and daughter cells differentiate and migrate upwards (right panel) 72 hrs after injection. (I) Similarly, KRT5-CreER labels individual basal progenitor cells in the forestomach with a low dose of Tamoxifen. (J) Three doses of Tamoxifen (0.25mg/g body weight) induce genetic recombination in ~75% and ~56% epithelial cells of the KRT5-CreER;Rosa26-lacZ esophagus and forestomach, respectively (n=3). Abbreviation: Lor, Loricrin; Krt, Keratin; Tmx, Tamoxifen. Scale bar: 50μm. See also Figure S1.
Figure 2
Figure 2. Sox2 Overexpression Promotes Self-renewal and Inhibits the Differentiation of Basal Progenitor Cells
(A) Schematic for the generation of KRT5-CreER;Rosa26Sox2/Sox2 (KRT5-CreER;R26Sox2/Sox2) compound mutants. The CAG promoter is a combination of the cytomegalovirus (CMV) early enhancer element and chicken beta-actin promoter. (B) Three doses of Tamoxifen induce Sox2 overexpression in the esophagus and forestomach as indicated by GFP expression. (C) Sox2 overexpression leads to epithelial hyperplasia in the esophagus and forestomach as shown by Hematoxylin and Eosin (H&E) immunohistochemistry. (D) Sox2 overexpression expands p63+ve progenitor cell populations in the esophagus and forestomach. (E) Sox2 overexpression leads to increased cell proliferation as indicated by phosphorylated Histone H3 (arrowheads). Note that proliferating cells are present in the surface layer (arrows). The corner insert is a higher magnification of the boxed region. (F) Sox2 overexpression inhibits the differentiation of basal progenitor cells in the esophagus and forestomach. Note that in the mutants the presence of patches of epithelial cells negative for the differentiation marker Loricrin. Refer to Figure S1F for individual fluorescent channels. Abbreviation: Fst, forestomach; Hst, hindstomach; Ep, epithelium; Me, mesenchyme. Scale bar: 50μm. See also Figure S1.
Figure 3
Figure 3. Sox2 Overexpression Leads to the Development of Invasive Squamous Cancer in the Forestomach
(A-B) Tumors are formed in the forestomach but not the esophagus at three months after Sox2 induction with two doses of Tamoxifen. (C-D) Tumor mass is positive for GFP (included in the Sox2 overexpression construct). (E-F) Cancer cells invade into the muscle layer as shown by H&E staining. (G-H) Cancer cells are positive for the basal progenitor marker p63. Inserts are high magnification of the boxed region in the section. Abbreviation: Eso, esophagus; Fst, forestomach; Hst, hindstomach; Duo, duodenum; Ep, epithelium; Me, mesenchyme; Mu, muscle. Scale bar: 50μm. See also Table S1.
Figure 4
Figure 4. Tumor Initiation in the Forestomach Involves Inflammatory Signaling after Sox2 Overexpression
(A) Progressive accumulation of neutrophils (Ly6c+) and macrophages (F4/80+) in the epithelium and mesenchyme of the hyperplastic forestomach. Two injections of Tamoxifen were used to induce Sox2 overexpression. While a small number of neutrophils and macrophages are present in the mesenchyme at day14, extensive infiltration of inflammatory cells appears in the damaged epithelium at day28 and day42. (B) Quantitative real-time RT-PCR (n=3) analysis shows increased transcript levels of IL-1β and IL-6 in the hyperplastic tissues after Sox2 overexpression. Data are represented as mean ± SEM. (C) p-Stat3 levels are increased in the nuclei of the hyperplasic and invading SCC epithelium in the mutants, as indicated by immunostaining. Note that tumor cells invade into the muscle layer which is positive for smooth muscle actin staining (arrows). (D) Inhibition of inflammation with serial injections of Dexamethasone in the hyperplastic forestomach after Sox2 overexpression. Note that the levels of IL-6 and p-Stat3 are decreased upon Dexamethasone injections. (E) Inhibition of Stat3 signaling with serial injections of the Stat3 inhibitor WP1066 in the hyperplastic forestomach. Note that Stat3 phosphorylation has largely been suppressed by the inhibitor in the epithelium and mesenchyme of the forestomach harvested two days after the final injection. Abbreviation: SMA, smooth muscle actin; Dex, Dexamethasone. Scale bar: 50μm. See also Figure S2 and Table S2, S3 and S4.
Figure 5
Figure 5. Co-overexpression of Sox2 and Constitutively Activated Stat3 (Stat3C) Leads to Malignant Transformation of Mouse Esophageal Basal Progenitors and Human Esophageal Progenitor-like EPC2 Cells
(A) Schematic of the experimental procedure for the transformation of Sox2-overexpressing esophageal basal progenitor cells with Stat3C lentivirus. (B) Representative colony of Sox2 overexpressing (GFP+ve) esophageal basal progenitor cells infected with Stat3C lentivirus. Basal progenitor cells were isolated from the esophagus of the KRT5-CreER;Rosa26Sox2/Sox2 mice after four doses of Tamoxifen. (C) Representative GFP+ve tumors developed in the immunodeficient NSG mice after injecting Sox2 and Stat3C co-overexpressing mouse esophageal basal progenitor cells. (D) Tumors initiated by Sox2 and Stat3C co-overexpressing basal progenitor cells are squamous cell carcinomas, as indicated by H&E staining. (E) Tumor cells express basal progenitor marker p63 and some of tumor cells are at proliferative state (phosphorylated Histone H3+ve). (F) EPC2 cells transformed with Sox2-IRES-eGFP and Stat3C express GFP as visualized with immunofluorescence microscopy. (G) Sox2 and Stat3C co-overexpressing EPC2 cells form spheres with high levels of GFP as visualized with immunofluorescence microscopy. (H-I) Representative GFP positive tumors form in the NSG mice after inoculation of Sox2 and Stat3C co-overexpressing EPC2 cells. (J) H&E staining to show that tumors initiated by Sox2 and Stat3C co-overexpressing EPC2 cells are squamous cell carcinomas. (K) Tumor cells express high levels of Sox2 in the nuclei. (L) Tumor cells express the basal progenitor cell marker p63. Scale bar: (C, H-I) 3mm; (D, E, G, J-L) 50μm. See also Figure S3.
Figure 6
Figure 6. shRNA-mediated Knockdown of Sox2 and Stat3 Reduces the Proliferation of Mouse Forestomach and Human Esophageal Squamous Cancer Cells
(A) Lentiviral shRNA knockdown of Sox2 or Stat3 increases the number of apoptotic cells and reduces the size of spheres formed by mouse forestomach squamous cancer cells. (B) Knockdown of Sox2 or Stat3 in forestomach cancer cells significantly reduces tumor weight after injection into immunodeficient NSG mice. Control is a representative tumor generated by forestomach cancer cells infected with virus containing scramble controls (n=6 for each group, p<0.01), and data are represented as mean ± SEM. (C-D) Lentiviral shRNA knockdown of SOX2, STAT3 or both reduces the proliferation of KYSE450 cells. The proliferating cells are indicated by the phosphorylated Histone H3 (pH3) immunostaining. Cell numbers in D were calculated by the average of cells in three wells for each group, and data are represented as mean ± SEM. (E) Knockdown of SOX2, STAT3, or both in KYSE450 cells significantly reduces tumor weight after injection into immunodeficient NSG mice. Control is a representative tumor generated by KYSE450 cells infected with virus containing scramble controls (n=6 for each group, p<0.01), and data are represented as mean ± SEM. Scale bar: 50μm. See also Figure S4.
Figure 7
Figure 7. High Levels of SOX2 and p-STAT3 are Associated with a Poor Prognosis of Human ESCC and Model Figure
(A) SOX2 is enriched in basal cells, and LORICRIN is expressed in differentiated suprabasal cells of human esophageal biopsies. (B) Basal cells are labeled by p75. (C) p-STAT3 is co-localized with SOX2 in ~8% of basal cells (arrowheads). Refer to Figure S5 for individual fluorescent channels. (D-F) Representative ESCC sample that has high levels of SOX2 and p-STAT3. (G) High levels of p-STAT3 in SOX2+ve esophageal SCCs predict a poor 5-year survival rate. Overall survival curves were plotted according to the Kaplan-Meier method, and p-value was calculated using log rank test. (H) Schematic of the squamous-columnar junction which separates the squamous (green) and columnar tissues (white) in the human and mouse upper gastrointestinal tract. Bile acid can cross the junction and induce injuries under pathological conditions. (I) Schematic in which Sox2 overexpression cooperates with inflammation-activated Stat3 to malignantly transform basal progenitor cells. a. Sox2 is expressed in the basal progenitor cells of the normal esophagus and forestomach. b. Sox2 overexpression expands basal progenitor cells by promoting proliferation and inhibiting differentiation. c. Bile acid reflux induces injury and inflammation in the expanded Sox2+ve progenitor cells. d. Sox2 and inflammation-activated Stat3 cooperate to transform basal progenitor cells and initiate invasive esophageal SCC. Inhibition of inflammation or Stat3 signaling reduces tumor incidence. Note that the top keratin layer is absent in the human esophagus. Abbreviation: Lor, Loricrin; SCJ, squamous-columnar junction; BA, bile acid; Eso, esophagus; Fst, forestomach; Hst, hindstomach; Duo, duodenum; BM, basement membrane. Scale bar: 50μm. See also Figure S5 and Table S5 and S6.

Comment in

References

    1. Andl CD, Mizushima T, Nakagawa H, Oyama K, Harada H, Chruma K, Herlyn M, Rustgi AK. Epidermal Growth Factor Receptor Mediates Increased Cell Proliferation, Migration, and Aggregation in Esophageal Keratinocytes in Vitro and in Vivo. Journal of Biological Chemistry. 2003;278:1824–1830. - PubMed
    1. Arnold K, Sarkar A, Yram MA, Polo JM, Bronson R, Sengupta S, Seandel M, Geijsen N, Hochedlinger K. Sox2(+) adult stem and progenitor cells are important for tissue regeneration and survival of mice. Cell Stem Cell. 2011;9:317–329. - PMC - PubMed
    1. Avilion AA, Nicolis SK, Pevny LH, Perez L, Vivian N, Lovell-Badge R. Multipotent cell lineages in early mouse development depend on SOX2 function. Genes Dev. 2003;17:126–140. - PMC - PubMed
    1. Barker N, Ridgway RA, van Es JH, van de Wetering M, Begthel H, van den Born M, Danenberg E, Clarke AR, Sansom OJ, Clevers H. Crypt stem cells as the cells-of-origin of intestinal cancer. Nature. 2009;457:608–611. - PubMed
    1. Bass AJ, Watanabe H, Mermel CH, Yu S, Perner S, Verhaak RG, Kim SY, Wardwell L, Tamayo P, Gat-Viks I, et al. SOX2 is an amplified lineage-survival oncogene in lung and esophageal squamous cell carcinomas. Nat Genet. 2009;41:1238–1242. - PMC - PubMed

Publication types

Substances