. 2013 Mar 6;77(5):845-58.
doi: 10.1016/j.neuron.2013.01.016.

Multiple mechanisms switch an electrically coupled, synaptically inhibited neuron between competing rhythmic oscillators

Affiliations

Multiple mechanisms switch an electrically coupled, synaptically inhibited neuron between competing rhythmic oscillators

Gabrielle J Gutierrez et al. Neuron. .

Abstract

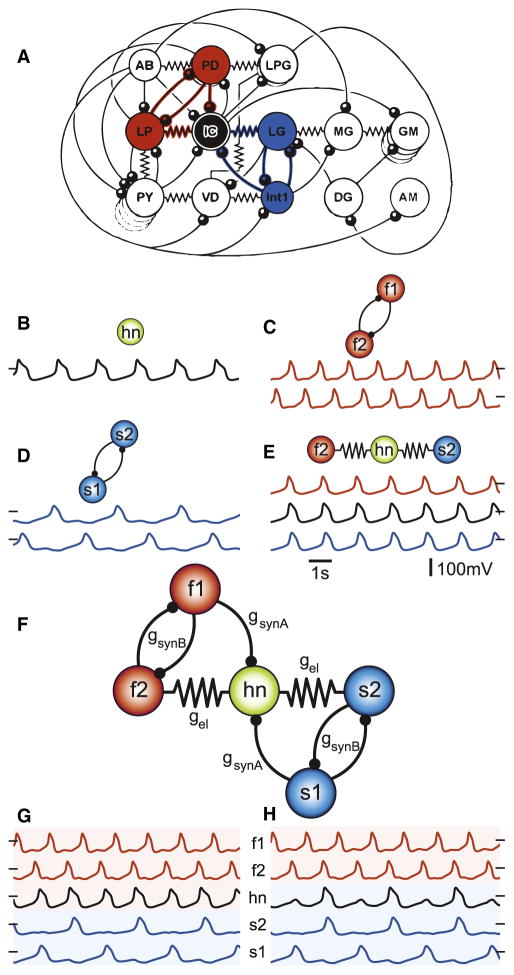
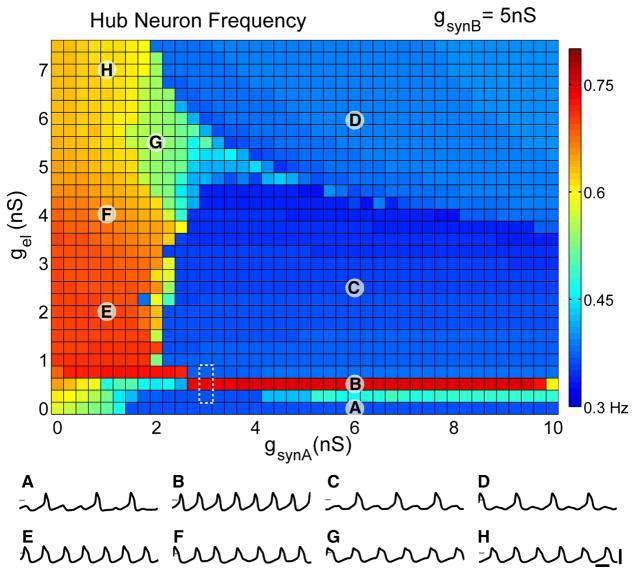
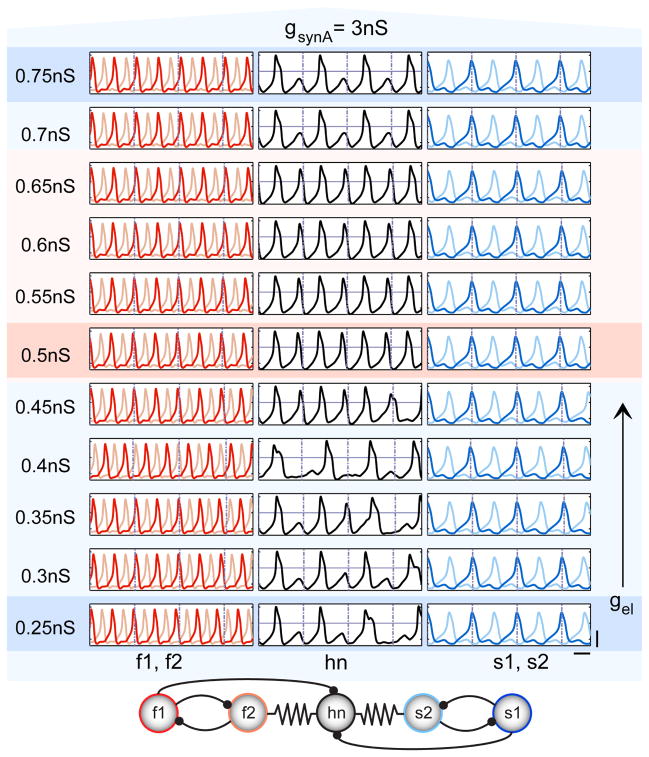
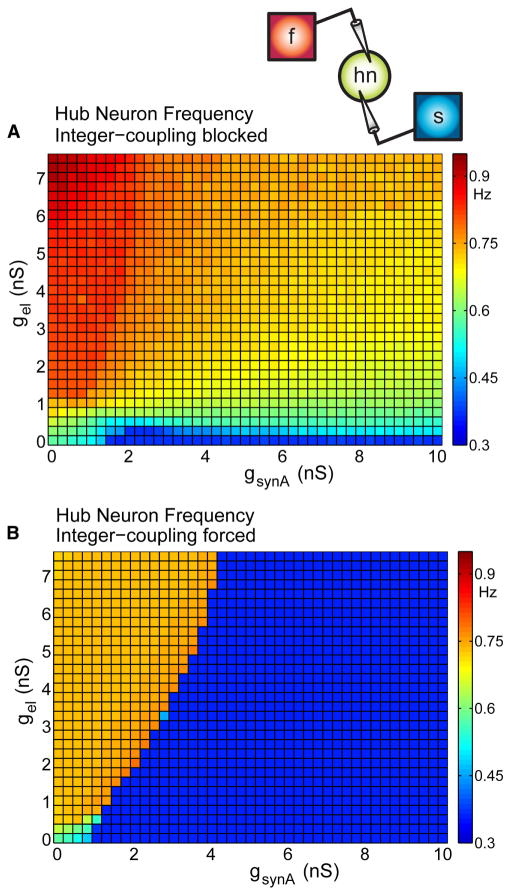
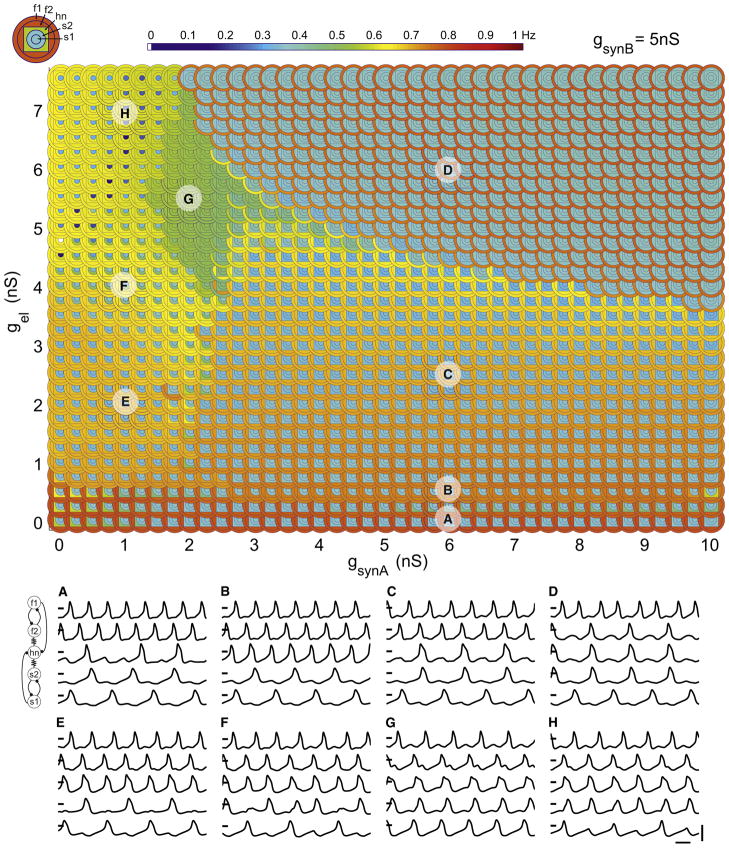
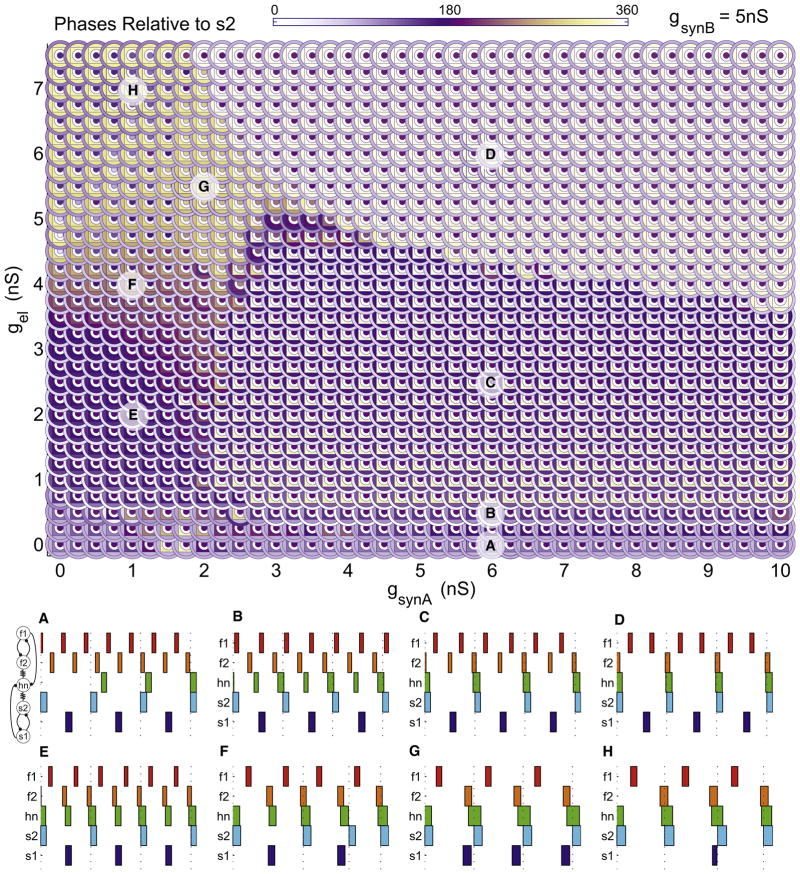
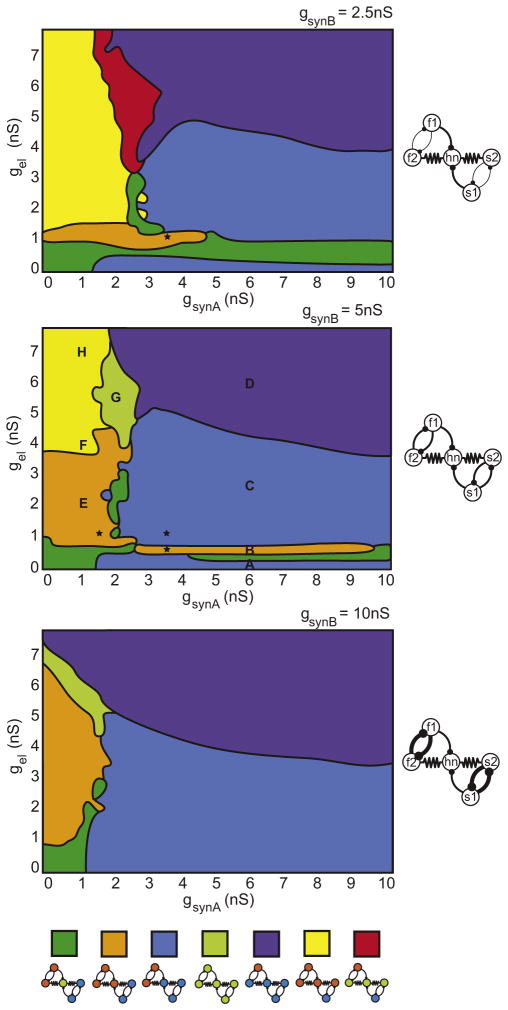
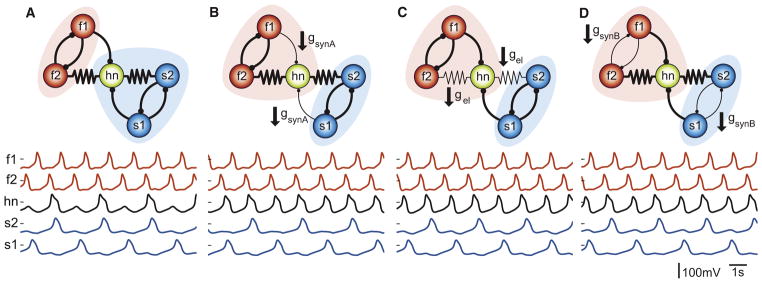
Rhythmic oscillations are common features of nervous systems. One of the fundamental questions posed by these rhythms is how individual neurons or groups of neurons are recruited into different network oscillations. We modeled competing fast and slow oscillators connected to a hub neuron with electrical and inhibitory synapses. We explore the patterns of coordination shown in the network as a function of the electrical coupling and inhibitory synapse strengths with the help of a novel visualization method that we call the "parameterscape." The hub neuron can be switched between the fast and slow oscillators by multiple network mechanisms, indicating that a given change in network state can be achieved by degenerate cellular mechanisms. These results have importance for interpreting experiments employing optogenetic, genetic, and pharmacological manipulations to understand circuit dynamics.


Figures

Figure 1
Figure 1. Connectivity Diagram of the C. borealis STG and Model Circuit
In all diagrams colored circles represent neurons, resistor symbols indicate electrical coupling, and arcs terminating in filled circles indicate inhibitory chemical synapses. (A) The PD and LP cells (red) are conventionally part of the pyloric (fast) circuit; LG and Int1 (blue) are nominally part of the (slow) gastric circuit. The IC neuron (black) has synaptic connections between the pyloric and gastric circuits. (B–D) Voltage trace of the isolated hub neuron, which has an intrinsic oscillation frequency of 0.57 Hz (B). Half-center oscillators are formed by reciprocally inhibiting fast (C) and slow (D) cells, producing rhythmic frequencies of 0.79 Hz and 0.36 Hz respectively. (E) Electrically coupling (gel = 5 nS) hn to f2 and s2 results in synchronous firing. (F) Connectivity diagram of the full model network used in this study. (G and H) Model-network voltage traces, from top to bottom: f1 (red), f2 (red), hn (black), s2 (blue), s1 (blue). (G) Example of hn oscillating with fast rhythm for a fixed set of synaptic parameters (gsynA = 1.5 nS, gel = 1.5 nS, gsynB = 5 nS). (H) Example of hn oscillating with the slow rhythm (gsynA = 2.5 nS, gel = 2.5 nS, gsynB = 5 nS). Black dashes indicate where membrane voltage is 0 mV.
Figure 2
Figure 2. Hub Neuron Frequency as a Function of gel and gsynA
Color map of mean hn frequency as a function of electrical synaptic conductance (gel) and inhibitory synaptic conductance (gsynA). Half-center synaptic strength is fixed throughout (gsynB = 5 nS). Hub neuron frequency is color coded with warm colors representing high frequencies (maximum = red = 0.80 Hz) and cool colors representing low frequencies (minimum = dark blue = 0.3 Hz). Labeled points (A–H) on the plot represent parameter sets corresponding to different regimes of hub neuron activity, with example traces shown beneath (scale bars represent 1 s, 100 mV; intersecting mark = 0 mV in each trace). The dashed white box indicates the tongue region examined in Figure 3.
Figure 3
Figure 3. Close-Up of Tongue Region
Voltage traces for the tongue region (as highlighted in the dashed, white box in Figure 2) with finer increments in gel; gsynA = 3 nS throughout. Background color roughly corresponds to hn frequency (red = high, blue = low) with the darker bands indicating the three points in the dashed white box of Figure 2. Dashed lines corresponding to s1 spikes are overlaid on all traces to elucidate when integer coupling becomes apparent. Scale bars for all traces represent 50 mV, 1 s. Five-cell network connectivity is displayed at the bottom.
Figure 4
Figure 4. Preventing the Influence of the Hub Neuron on the Rest of the Network
(A) Conductance waveforms fed into hn at natural half-center oscillator frequencies (slow 0.36 Hz, fast = 0.79 Hz). (B) Driving hn with conductance waveforms resulting from a precise 2:1 frequency and zero-phase relation (slow 0.36 Hz, fast = 0.72 Hz).
Figure 5
Figure 5. Parameterscape of Network Frequencies as a Function of gel and gsynA
A plot showing the firing frequency of each of the five cells in the model network, color coded according to the key (top left) with the color scale to the right of the plot. Each cell corresponds to a concentric ring from outermost to innermost as follows: f1, f2, hn (square), s2, and s1. Within the parameterscape, regions of patterned network activity and hub neuron switching are apparent. (A–H) Example voltage traces corresponding to each labeled region. Traces from top to bottom are f1, f2, hn, s2, and s1. (A) hn oscillates irregularly at low frequency (gsynA = 6 nS, gel = 0 nS). (B) As electrical conductance is increased (gsynA = 6 nS, gel = 0.5 nS), hn switches its activity to join the fast rhythm. (C) A further increase in electrical conductance causes hn to oscillate in time with the slow rhythm (gsynA = 6 nS, gel = 2.5 nS). (D) Increasing electrical conductance further still (gsynA = 6 nS, gel = 6 nS) leaves hn oscillating in time with the slow rhythm; however, f2 also oscillates with the slow rhythm. (E) hn oscillates in time with the fast rhythm (gsynA = 1 nS, gel = 2 nS). (F) hn again oscillates in time with the fast rhythm but s2 oscillates irregularly (gsynA = 1 nS, gel = 4 nS). (G) All cells in the network oscillate at the same intermediate frequency (gsynA = 2 nS, gel = 5.5 nS). (H) hn oscillates at a slightly higher frequency than in (G) along with all other neurons except for s1, which oscillates at half this frequency (gsynA = 1 nS, gel = 7 nS). All traces: scale bars represent 100 mV, 1 s; intersecting marks = 0 mV.
Figure 6
Figure 6. Phase Relations Reveal Patterned Network Output
The phase of each neuron relative to the ON phase of s2 is plotted on the parameterscape, with relative phase color coded in concentric rings as in Figure 5. Neurons that are in phase with s2 are represented in white and those in antiphase are violet. Phase diagrams are shown for each of the points on the parameterscape labeled (A)–(H) (bottom). Each block represents the ON period (Vm > 0 mV) for each neuron. Four full ON periods for s2 are shown in each case.
Figure 7
Figure 7. Network Activity for Different Half-Center Coupling Strengths
Schematic maps of network frequency relationships for different values of half-center coupling strength, gsynB = 2.5 nS, 5 nS, and 10 nS (top to bottom). Each colored region represents a different class of network activity as shown by the legend at the bottom (blue cells = oscillating in time with slow rhythm, green cells = oscillating at intermediate frequency, orange cells = oscillating with fast rhythm). Black stars correspond to the activity shown in Figure 8.
Figure 8
Figure 8. There Are Multiple Solutions for Switching Hub Neuron Activity between Competing Oscillators
(A) The model network with a given set of synaptic conductances (gsynA = 3.5 nS, gsynB = 5 nS, gel = 1 nS) produces a behavior in which the hub neuron oscillates with the slow rhythm. Switching the hub neuron to oscillate with the fast rhythm can be achieved by any one of the following three synaptic changes. (B) Decreasing gsynA to 1.5 nS switches the hub neuron into the fast rhythm (gsynA = 1.5 nS, gsynB = 5 nS, gel = 1 nS). (C) Decreasing gel to 0.5 nS switches the hub neuron to the fast rhythm (gsynA = 3.5 nS, gsynB = 5 nS, gel = 0.5 nS). (D) Decreasing gsynB to 2.5 nS also switches the hub neuron to the fast rhythm (gsynA = 3.5 nS, gsynB = 2.5 nS, gel = 1 nS).

References

    1. Ainsworth M, Lee S, Cunningham MO, Roopun AK, Traub RD, Kopell NJ, Whittington MA. Dual γ rhythm generators control interlaminar synchrony in auditory cortex. J Neurosci. 2011;31:17040–17051. - PMC - PubMed
    1. Bargmann CI. Beyond the connectome: how neuromodulators shape neural circuits. Bioessays. 2012;34:458–465. - PubMed
    1. Bem T, Rinzel J. Short duty cycle destabilizes a half-center oscillator, but gap junctions can restabilize the anti-phase pattern. J Neurophysiol. 2004;91:693–703. - PubMed
    1. Bem T, Le Feuvre Y, Rinzel J, Meyrand P. Electrical coupling induces bistability of rhythms in networks of inhibitory spiking neurons. Eur J Neurosci. 2005;22:2661–2668. - PubMed
    1. Bennett MV. Electrical synapses, a personal perspective (or history) Brain Res Brain Res Rev. 2000a;32:16–28. - PubMed

Publication types