. 2013 Mar 6;77(5):886-98.
doi: 10.1016/j.neuron.2013.01.012.

Aberrant Schwann cell lipid metabolism linked to mitochondrial deficits leads to axon degeneration and neuropathy

Affiliations

Aberrant Schwann cell lipid metabolism linked to mitochondrial deficits leads to axon degeneration and neuropathy

Andreu Viader et al. Neuron. .

Abstract

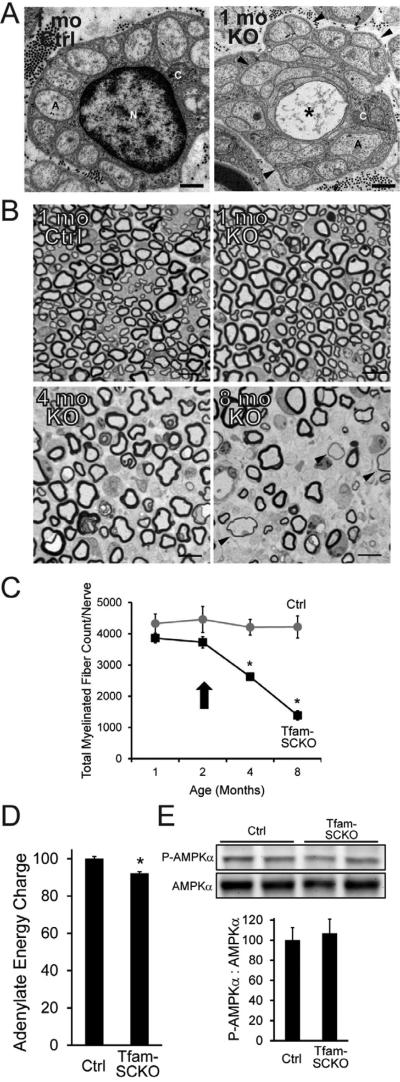
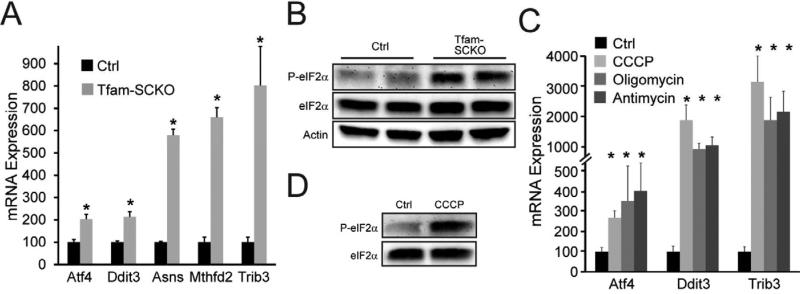
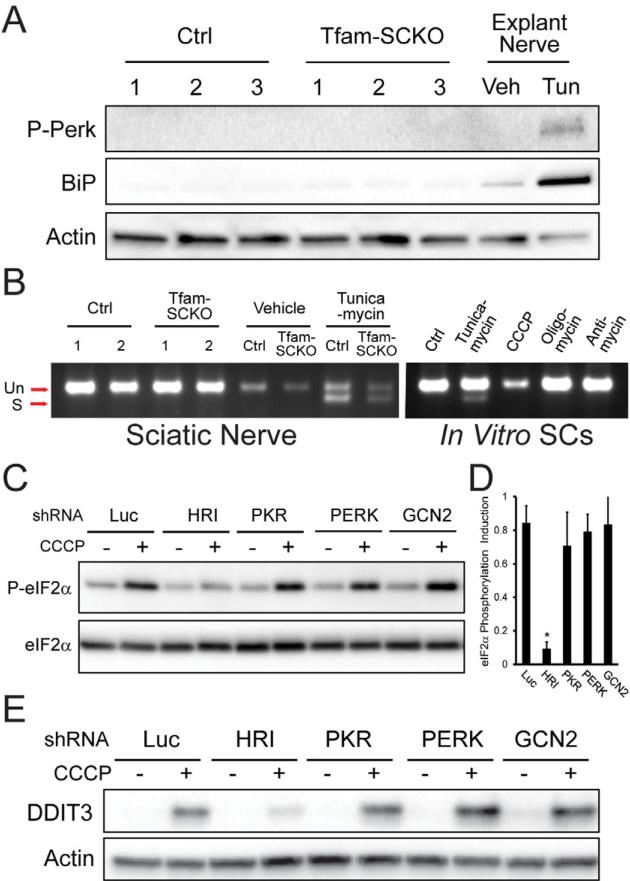
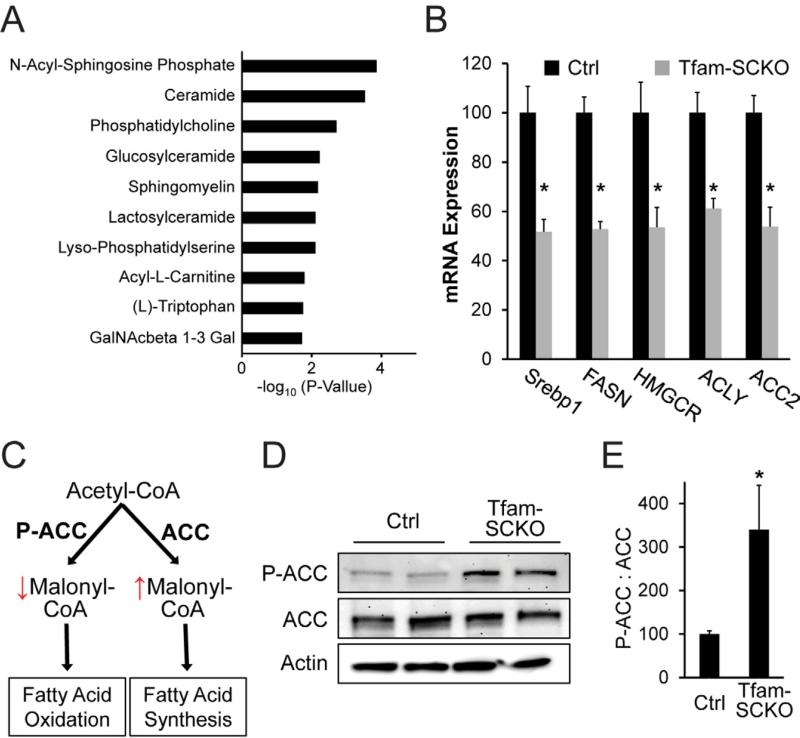
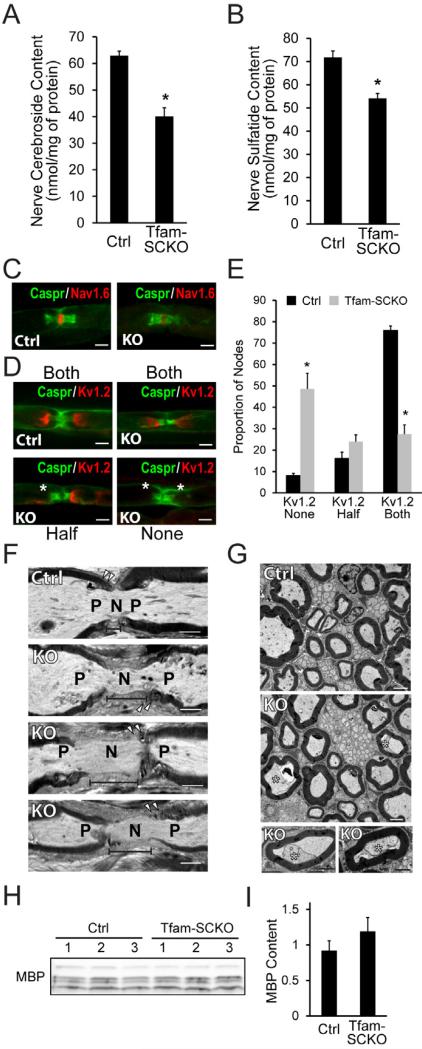
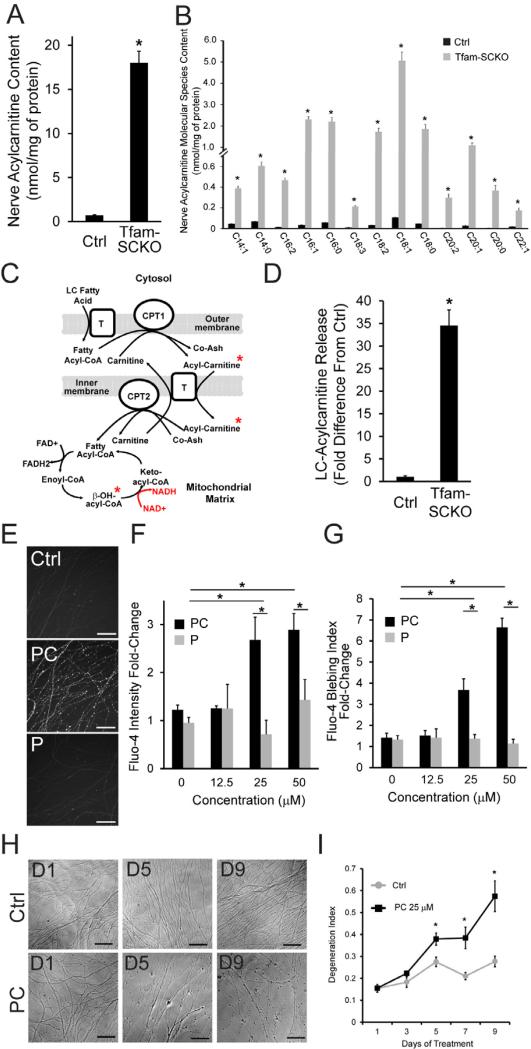
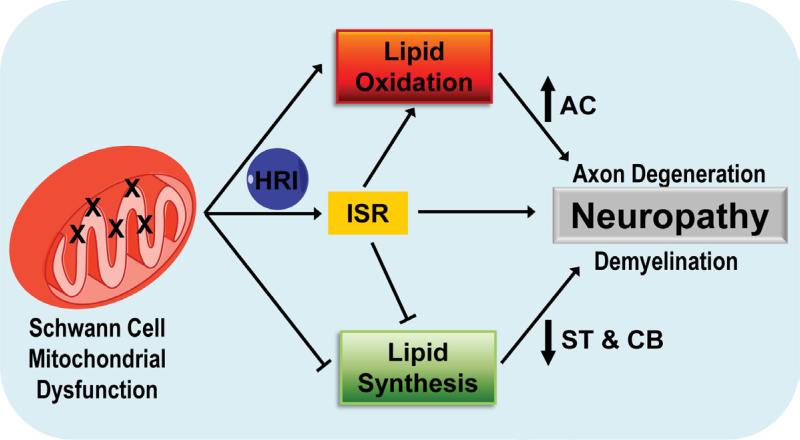
Mitochondrial dysfunction is a common cause of peripheral neuropathy. Much effort has been devoted to examining the role played by neuronal/axonal mitochondria, but how mitochondrial deficits in peripheral nerve glia (Schwann cells [SCs]) contribute to peripheral nerve diseases remains unclear. Here, we investigate a mouse model of peripheral neuropathy secondary to SC mitochondrial dysfunction (Tfam-SCKOs). We show that disruption of SC mitochondria activates a maladaptive integrated stress response (ISR) through the actions of heme-regulated inhibitor (HRI) kinase, and causes a shift in lipid metabolism away from fatty acid synthesis toward oxidation. These alterations in SC lipid metabolism result in depletion of important myelin lipid components as well as in accumulation of acylcarnitines (ACs), an intermediate of fatty acid β-oxidation. Importantly, we show that ACs are released from SCs and induce axonal degeneration. A maladaptive ISR as well as altered SC lipid metabolism are thus underlying pathological mechanisms in mitochondria-related peripheral neuropathies.


Figures

Figure 1
Figure 1. SC mitochondrial dysfunction induces a progressive, degenerative peripheral neuropathy that is not directly linked to energy depletion
(A) Electron micrographs of 1-month-old Ctrl and Tfam-SCKO sciatic nerve cross sections depicting early structural abnormalities of Remak bundles (SC surrounding multiple unmyelinated axons; arrowheads) and degeneration of unmyelinated axons (asterisk). A, axon; N, SC nucleus; C, SC cytoplasm. Scale bar 500 nm. (B, C) Toluidene blue stained plastic sections of Tfam-SCKO and Ctrl sciatic nerve cross sections (B) and quantification of total number of myelinated profiles per nerve (C) at different ages show prominent, progressive degeneration of large-caliber myelinated axons and demyelination starting at 3-4 months of age. Arrowheads (B) indicate axons surrounded by unusually thin myelin, a sign of demyelination. Arrow (C) indicates the point in the progression of the pathology for all mice used in later experiments; note that at this age nerves display only limited, early pathological changes with minimal axon loss and demyelination. N=4 mice per genotype at each age. *P<0.01 Scale bar 25 μm. (D) Adenylate energy charge in 2-month-old Tfam-SCKO nerves shows only a slight decrease in the energy levels of Tfam-deficient SCs compared to Ctrl nerves. N=8 mice per genotype. *P<0.01 (E) Immunoblot analysis and quantification of band intensity reveals no increase in the phosphorylation (activation) of the energy sensor AMPK in 2-month-old Tfam-SCKO nerves, indicating that energy depletion is an unlikely driver of nerve pathology in these mice. N=4 mice per genotype.
Figure 2
Figure 2. SC mitochondrial dysfunction activates a maladaptive integrated stress response (ISR)
(A) SC mitochondrial dysfunction upregulates the expression of ISR target genes in 2-month-old Tfam-SCKO nerves compared to Ctrl as measured by qRT-PCR. ATF4, activating transcription factor 4; Ddit3, DNA-damage inducible transcript 3; ASNS, asparagine synthetase; MTHFD2, methylenetetrahydrofolate dehydrogenase; TRIB3, tribbles homolog 3. N=5 mice per genotype. *P<0.05 (B) Immunoblot analysis shows increased phosphorylation of eIF2α in 2-month-old Tfam-SCKO vs. Ctrl nerves, confirming the activation of the ISR (C) Inhibition of mitochondrial respiration in cultured SCs with mitochondrial inhibitors upregulates the expression of ISR target genes as measured by qRT-PCR. N=duplicate wells from 3 independent experiments. *P<0.05. (D) Immunoblot analysis shows that application of the mitochondrial inhibitor CCCP to cultured SCs increases phosphorylation of eIF2α, indicating that inhibition of the mitochondrial electron transport chain activates the ISR.
Figure 3
Figure 3. Mitochondrial dysfunction-induced ISR activation in SCs is mediated by heme-regulated inhibitor (HRI) kinase independent of ER-stress
(A) Immunoblot analysis of the phosphorylation (activation) status of the ER-stress sensor Perk and the UPR-induced molecular chaperone BiP/Grp78 in 2-month-old Ctrl and Tfam-SCKO nerves (3 independent mice per genotype) shows no differences, indicating that ISR activation following SC mitochondrial deficits does not involve ER-stress. Tunicamycin (Tun) treatment of sciatic nerves cultured as explants, serves as a positive control for ER-stress. Veh, vehicle. (B) Gel showing the absence of Xbp-1 splicing downstream of the activation of the ER-stress sensor Ire-1 in 2-month-old Tfam-SCKO nerves, or SCs treated with mitochondrial inhibitors, confirms that ISR activation induced by mitochondrial derangement is independent of ER-Stress. Tunicamycin treatment of cultured SCs or sciatic nerves cultured as explants serve as positive controls for ER-stress. (C) Immunoblot analysis of eIF2α phosphorylation in 3T3 cells expressing shRNA to the indicated eIF2α kinases (HRI, PKR, PERK, GCN2) that were treated for three hrs with 5 μM CCCP to inhibit mitochondrial respiration. Knockdown of HRI (but not of GCN2, PKR or PERK) is sufficient to prevent eIF2α phosphorylation following inhibition of mitochondrial respiration, indicating the specific role of HRI in this process. (D) Quantification of the immunoblot as shown in (C) by densitometry. N=3 independent experiments. (E) Immunoblot analysis of the induction the ISR mediator DDIT3/CHOP 6 hrs after inhibition of mitochondrial respiration with 5 μM CCCP in 3T3 cells in which expression of indicated eIF2a kinase (HRI, PKR, PERK, GCN2) was knocked down using shRNA. Knockdown of HRI (but not of GCN2, PKR or PERK) is sufficient to prevent DDIT3/CHOP induction downstream of eIF2α phosphorylation following inhibition of mitochondrial respiration.
Figure 4
Figure 4. SC mitochondrial dysfunction causes a shift in lipid metabolism away from lipid biosynthesis and toward fatty acid oxidation
(A) Differentially expressed mRNAs in 2-month-old Tfam-SCKO nerves as determined by microarray analysis are enriched for genes involved in lipid metabolism pathways. The 10 pathways with most significant enrichment among differentially expressed genes in Tfam-SCKO nerves are shown. (B) qRT-PCR analysis confirms that a number of lipid synthesis related enzymes are downregulated in 2-month-old Tfam-SCKO vs. Ctrl nerves. SREBP1, sterol regulatory element binding transcription factor 1; FASN, fatty acid synthase; HMGCR, 3-hydroxy-3-methylglutaryl-Coenzyme A reductase; ACLY, ATP citrate lyase; ACC2, acetyl-Coenzyme A carboxylase beta (primarily localized to mitochondria). N=5 mice per genotype. *P<0.05. (C) Diagram depicting the regulation by acetyl-coA carboxylase (ACC) of the balance between fatty acid synthesis vs. oxidation and how it is altered by ACC's phosphorylation status. (D, E) Immunoblot analysis (D) and quantification of band intensity (E) show increased phosphorylation of ACC in 2-month-old Tfam-SCKO nerves. Phosphorylation inhibits this central regulator of the balance between lipid synthesis vs. oxidation, indicating (together with gene expression results) a shift in lipid metabolism away from new lipid synthesis and towards increased lipid oxidation in SC following mitochondrial dysfunction. N=4 mice per genotype. *P<0.05.
Figure 5
Figure 5. Abnormal lipid metabolism secondary to mitochondrial dysfunction results in depletion of myelin lipid components and disrupts axon-SC interactions in Tfam-SCKO nerves
(A, B) Lipidomic analysis reveals an early and significant depletion of two key myelin lipid components, cerebrosides (A) and sulfatides (B), in 2-month-old Tfam-SCKO vs. Ctrl nerves. N=5 mice per genotype. *P<0.05. (C, D) Immunostaining of nodal architecture in 2-month-old Ctrl and Tfam-SCKO nerves with antibodies against nodal (Nav1.6, C), paranodal (Caspr, C and D), and juxtaparanodal (Kv1.2, D) markers shows normal clustering of voltage-gated sodium channels (Nav1.6, C) but aberrant localization or loss of voltage-gated potassium channel clusters (Kv1.2, D) around a significant number of nodes following cerebroside and sulfatide depletion. Asterisks mark missing Kv1.2 clusters (D). Scale bar 50 μm. (E) Quantification of the number of nodes in 2-month-old Ctrl and Tfam-SCKO nerves with intact Kv1.2 clusters (both) or with missing Kv1.2 clusters at either one (half) or both sides of the node (none) as visualized in (D) confirms disruption of ion channel clustering in Tfam-SCKO vs. Ctrl nerves following reductions in myelin-lipid components. N=3 mice per genotype at each age. *P<0.05. (F) Longitudinal electron micrographs from 2-month-old Tfam-SCKO sciatic nerves show enlarged nodal gaps compared to Ctrls (segment line), indicating abnormal axo-glial contacts around the nodes of Ranvier. N, node; P, paranode; Arrowheads, paranodal loops. Scale bar 2 μm. (G) Cross-sectional electron micrographs from 2-month-old Tfam-SCKO sciatic nerves display a significant number of axons that have pulled away from their myelin ensheathments (asterisks) compared to Ctrls, indicating disrupted axo-glial adhesion in Tfam-SCKOs following cerebroside and sulfatide depletion. Scale bar 2 μm. (H, I) Immunoblot analysis of 2-month-old nerves (H) and quantification (I) reveals that sulfatide and cerebroside depletion precedes any decrease in expression of nerve myelin basic protein (MBP), making lipid depletion a potential driver of the later demyelination. N=3 mice per genotype.
Figure 6
Figure 6. SC accumulation and release of acylcarnitine fatty acid β-oxidation intermediates secondary to mitochondrial dysfunction disrupts axonal calcium homeostasis and stability
(A, B). Lipidomic analysis shows a significant accumulation of long-chain acylcarnitines (total, A) that affects most long-chain molecular species (B) in 2-month-old Tfam-SCKO vs. Ctrl nerves. N=5 mice per genotype. *P<0.05. (C) Diagram depicting fatty acid β-oxidation in the mitochondria. Long-chain fatty acids are converted to acylcarnitines to be shuttled into the mitochondrial matrix, the site of β-oxidation, where they are oxidized through repeated cycles of four enzymatic reactions. Red text indicates the altered ratio of NAD/NADH+ in Tfam-SCKO nerves. Red stars indicate lipid intermediates accumulating in Tfam-SCKO nerves following mitochondrial dysfunction. Cpt1 and Cpt2: carnitine palmitoyltransferase 1 and 2; T outer: long-chain fatty acid transporter; T inner: carnitine-acylcarnitine translocase; Co-Ash: coenzyme A. (D) Explanted 2-month-old Tfam-SCKO nerves but not Ctrl nerves release long-chain acylcarnitines into surrounding culture media as measured by mass spectrometry. N=6 mice per genotype. *P<0.05. (E) Images depicting increased fluorescence intensity of the Ca2+ dye Fluo-4 after acute (30 min) application of palmitoyl-carnitine (PC), an acylcarnitine species highly increased in Tfam-SCKO nerves, shows that this lipid intermediate can disrupt axonal calcium homeostasis. Note that similar changes were not seen when the corresponding free fatty acid (Palmitate, P) was applied. Scale bar, 100 μm. (F, G) Quantification of the effect of palmitoyl-carnitine on Fluo-4 intensity (F) and Ca2+ blebbing (G) shows that the effect of this lipid intermediate on axonal calcium is dose-dependent, and specific to acylcarnitines; application of the corresponding free fatty acid at the same concentrations exerted no comparable effect. N=triplicate wells from 1 out of 3 representative experiments. *P<0.05. (H) Images depicting a progressive increase in axonal degeneration following chronic application of 25 μM palmitoyl-carnitine (PC) for 9 days. Scale bar, 100 μm. (I) Quantification of axonal degeneration after chronic treatment with 25 μM palmitoyl-carnitine (PC) shows a significant, progressive increase in the axon degeneration index. N=3 independent experiments with 4-6 wells per condition. *P<0.05.
Figure 7
Figure 7. Altered SC lipid metabolism accompanied by the toxic accumulation of lipid intermediates induces axonal degeneration and demyelination in mitochondria-related peripheral neuropathies
Diagram describing the proposed model for how activation of a maladaptive integrated stress response as well as a shift in lipid metabolism away from lipid synthesis and towards lipid oxidation secondary to SC mitochondrial dysfunction may contribute to the pathology in peripheral neuropathies. HRI: heme-regulated inhibitor kinase; CB: cerebrosides; ST: sulfatides; AC: acylcarnitine

Comment in

References

    1. Atkinson DE. The energy charge of the adenylate pool as a regulatory parameter. Interaction with feedback modifiers. Biochemistry. 1968;7:4030–4034. - PubMed
    1. Baloh RH. Mitochondrial dynamics and peripheral neuropathy. Neuroscientist. 2008;14:12–18. - PubMed
    1. Barber MC, Price NT, Travers MT. Structure and regulation of acetyl-CoA carboxylase genes of metazoa. Biochim Biophys Acta. 2005;1733:1–28. - PubMed
    1. Barres B. a. The mystery and magic of glia: a perspective on their roles in health and disease. Neuron. 2008;60:430–440. - PubMed
    1. Chrast R, Saher G, Nave KA, Verheijen MH. Lipid metabolism in myelinating glial cells: lessons from human inheriteddisorders and mouse models. J Lipid Res. 2010;52(3):419–34. - PMC - PubMed

Publication types

MeSH terms

Associated data