

Histopathologic characteristics of atherosclerotic coronary disease and implications of the findings for the invasive and noninvasive detection of vulnerable plaques
- PMID: 23473409
- PMCID: PMC3931303
- DOI: 10.1016/j.jacc.2012.10.054
Histopathologic characteristics of atherosclerotic coronary disease and implications of the findings for the invasive and noninvasive detection of vulnerable plaques
Abstract
Objectives: The goal of this study was to identify histomorphologic characteristics of atherosclerotic plaques and to determine the amenability of some of these components to be used as markers for invasive and noninvasive imaging.
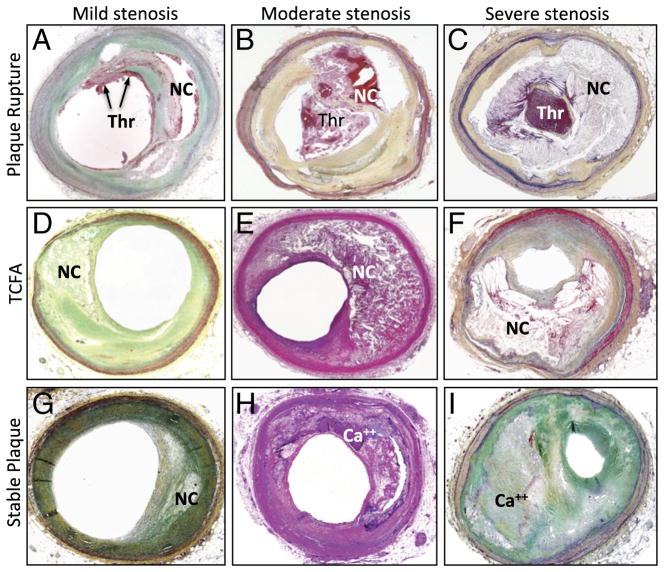
Background: Rupture of the atherosclerotic plaques is responsible for the majority of acute coronary events, and the culprit lesions demonstrate distinct histopathologic features. It has been tacitly believed that plaque rupture (PR) is associated with angiographically minimally occlusive lesions.
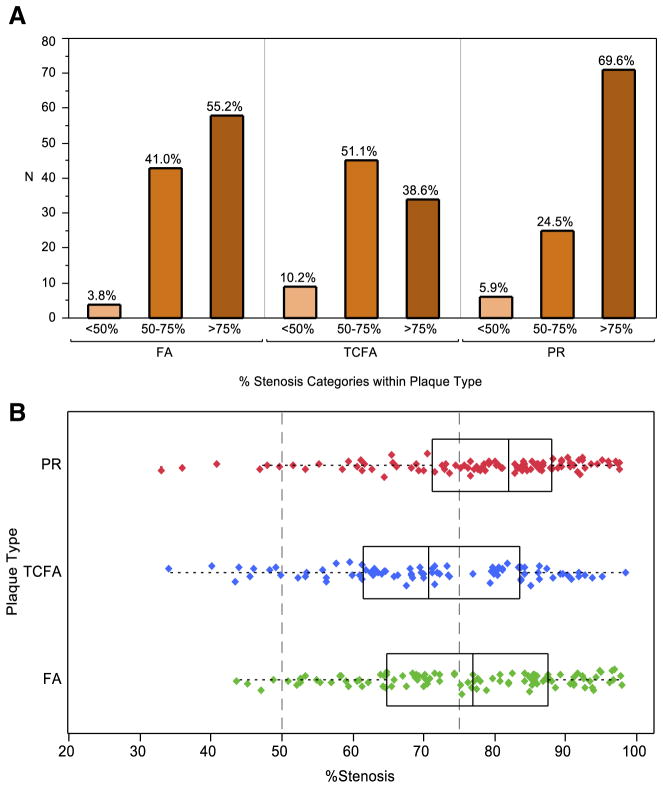
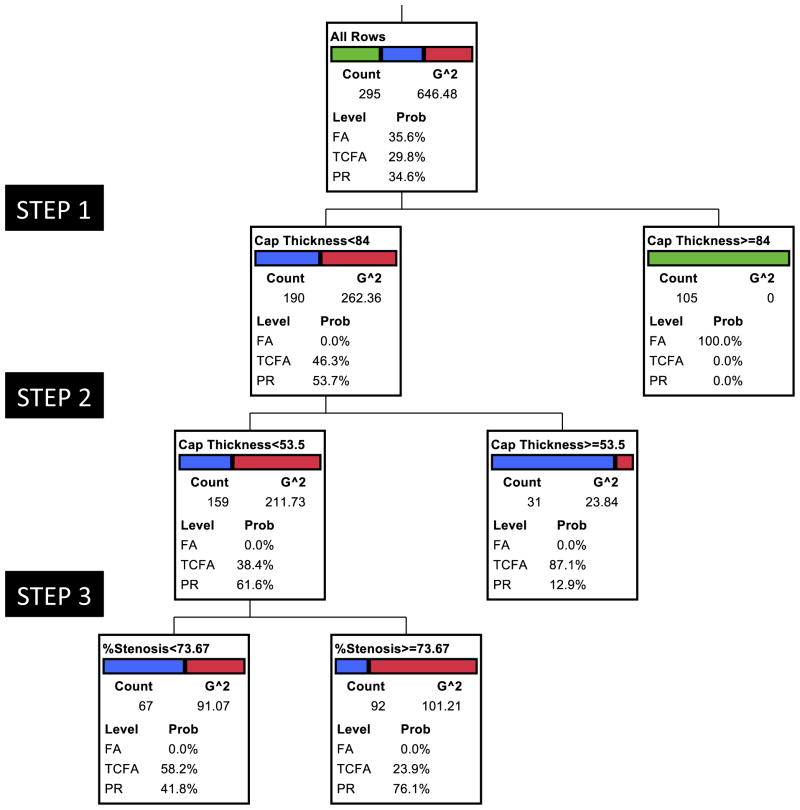
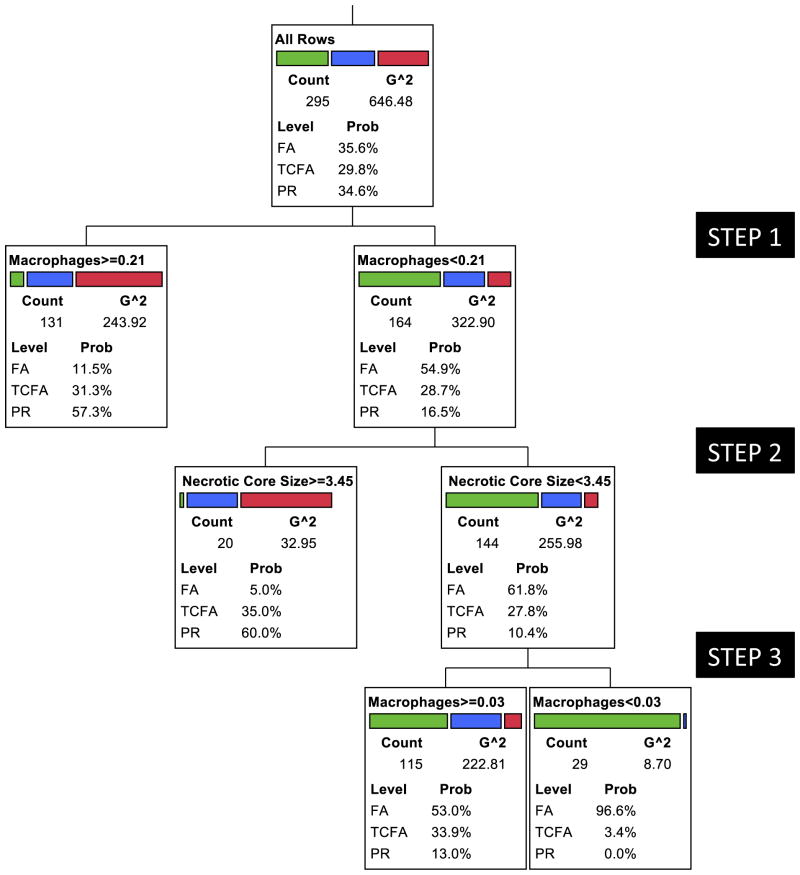
Methods: We obtained 295 coronary atherosclerotic plaques, including stable (fibroatheroma [FA]; n = 105), vulnerable (thin-cap fibroatheroma [TCFA]; n = 88), and disrupted plaques (plaque rupture [PR]; n = 102) from the hearts of 181 men and 32 women who had died suddenly. The hierarchical importance of fibrous cap thickness, percent luminal stenosis, macrophage area, necrotic core area, and calcified plaque area was evaluated by using recursive partitioning analysis. Because clinical assessment of fibrous cap thickness is not possible by noninvasive imaging, it was excluded from the second set of partitioning analysis.
Results: Thickness of the fibrous cap emerged as the best discriminator of plaque type; the cap thickness measured <55 μm in ruptured plaques, and all FA were associated with >84-μm cap thickness. Although the majority of TCFA were found in the 54- to 84-μm thickness group, those with <54-μm thickness were more likely to show <74% luminal stenosis (area under the curve: FA, 1.0; TCFA, 0.89; PR, 0.90). After exclusion of cap thickness, analysis of the plaque characteristics revealed macrophage infiltration and necrotic core to be the 2 best discriminators of plaque types (area under the curve: FA, 0.82; TCFA, 0.58; PR, 0.72). More than 75% cross-section area stenosis was seen in 70% of PR and 40% of TCFA; only 5% PR and 10% TCFA were <50% narrowed.
Conclusions: This postmortem study defines histomorphologic characteristics of vulnerable plaques, which may help develop imaging strategies for identification of such plaques in patients at a high risk of sustaining acute coronary events.
Copyright © 2013 American College of Cardiology Foundation. Published by Elsevier Inc. All rights reserved.
Figures

Comment in
-
In search of the elusive vulnerable plaque: reducing the gap between coronary imaging and necropsy findings.J Am Coll Cardiol. 2013 Mar 12;61(10):1052-3. doi: 10.1016/j.jacc.2012.12.013. J Am Coll Cardiol. 2013. PMID: 23473410 No abstract available.
References
-
- Braunwald E. Epilogue: what do clinicians expect from imagers? J Am Coll Cardiol. 2006;47(Suppl c):C101–3. - PubMed
-
- Braunwald E. Noninvasive detection of vulnerable coronary plaques: locking the barn door before the horse is stolen. J Am Coll Cardiol. 2009;54:58–9. - PubMed
-
- Wilson PW, D’Agostino RB, Levy D, et al. Prediction of coronary heart disease using risk factor categories. Circulation. 1998;97:1837– 47. - PubMed
-
- Wood D, De Backer G, Faergeman O, et al. Prevention of coronary heart disease in clinical practice: recommendations of the Second Joint Task Force of European and Other Societies on Coronary Prevention. Eur Heart J. 1998;19:1434–503. - PubMed
-
- Davies MJ. The composition of coronary-artery plaques. N Engl J Med. 1997;336:1312–4. - PubMed
MeSH terms
Grants and funding
LinkOut - more resources
Full Text Sources
Other Literature Sources
Medical
Research Materials
Miscellaneous
