. 2013 May 15;85(10):1542-54.
doi: 10.1016/j.bcp.2013.02.030. Epub 2013 Mar 6.

The insecticidal neurotoxin Aps III is an atypical knottin peptide that potently blocks insect voltage-gated sodium channels

Affiliations

The insecticidal neurotoxin Aps III is an atypical knottin peptide that potently blocks insect voltage-gated sodium channels

Niraj S Bende et al. Biochem Pharmacol. .

Abstract

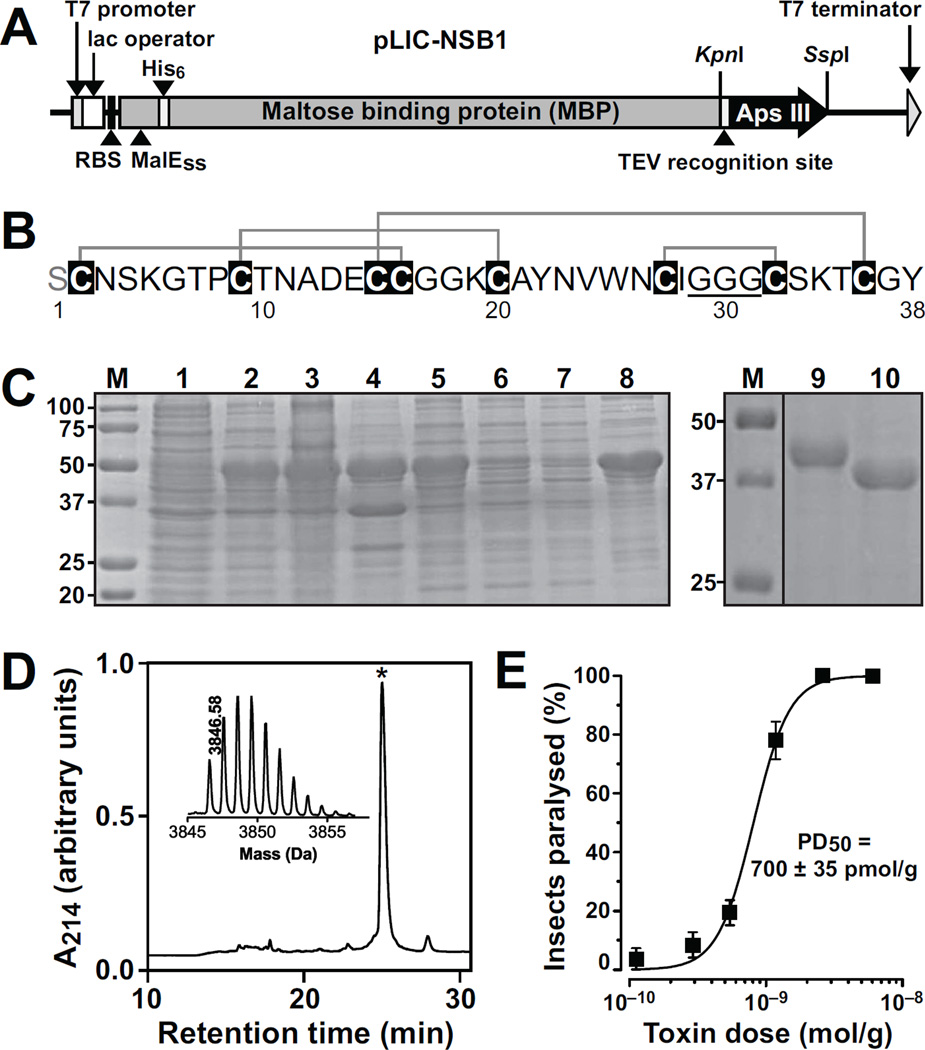
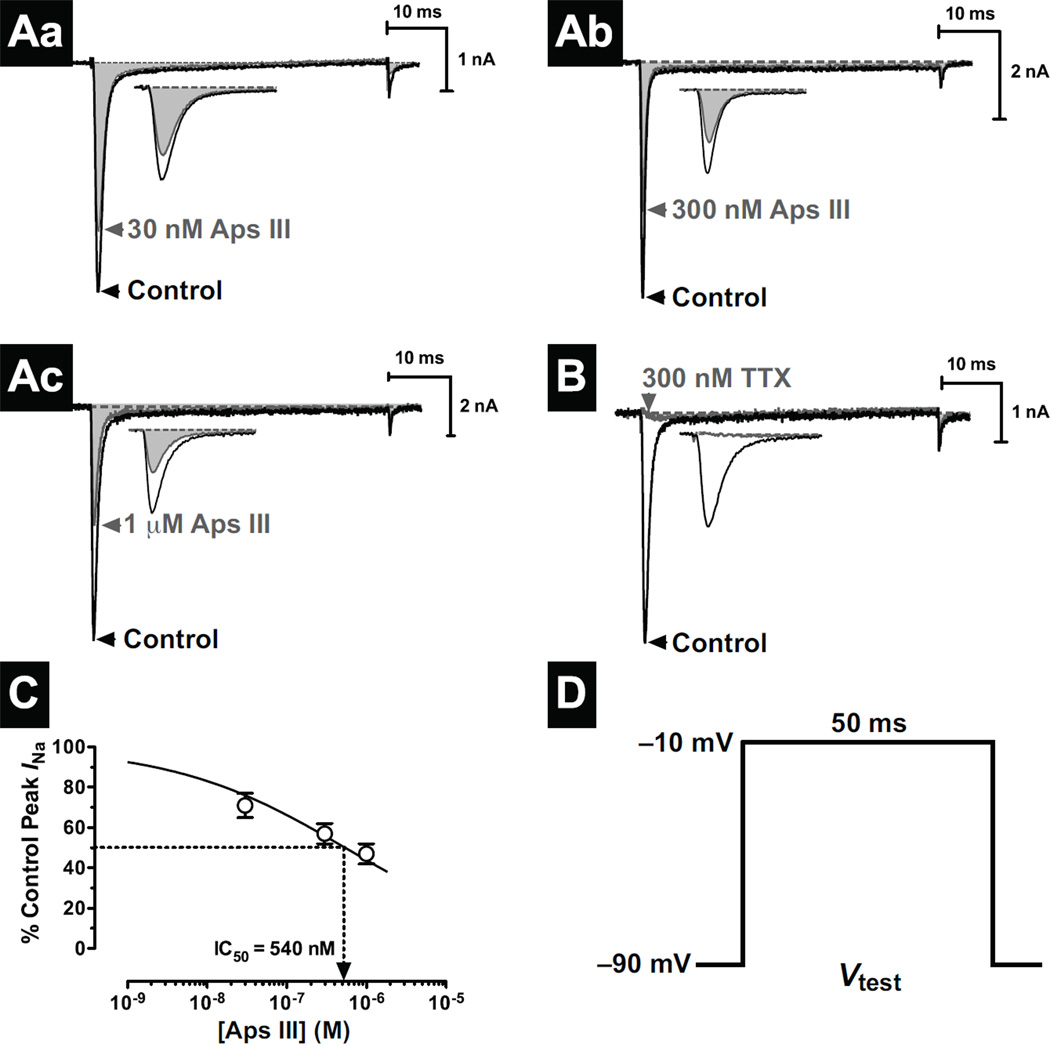
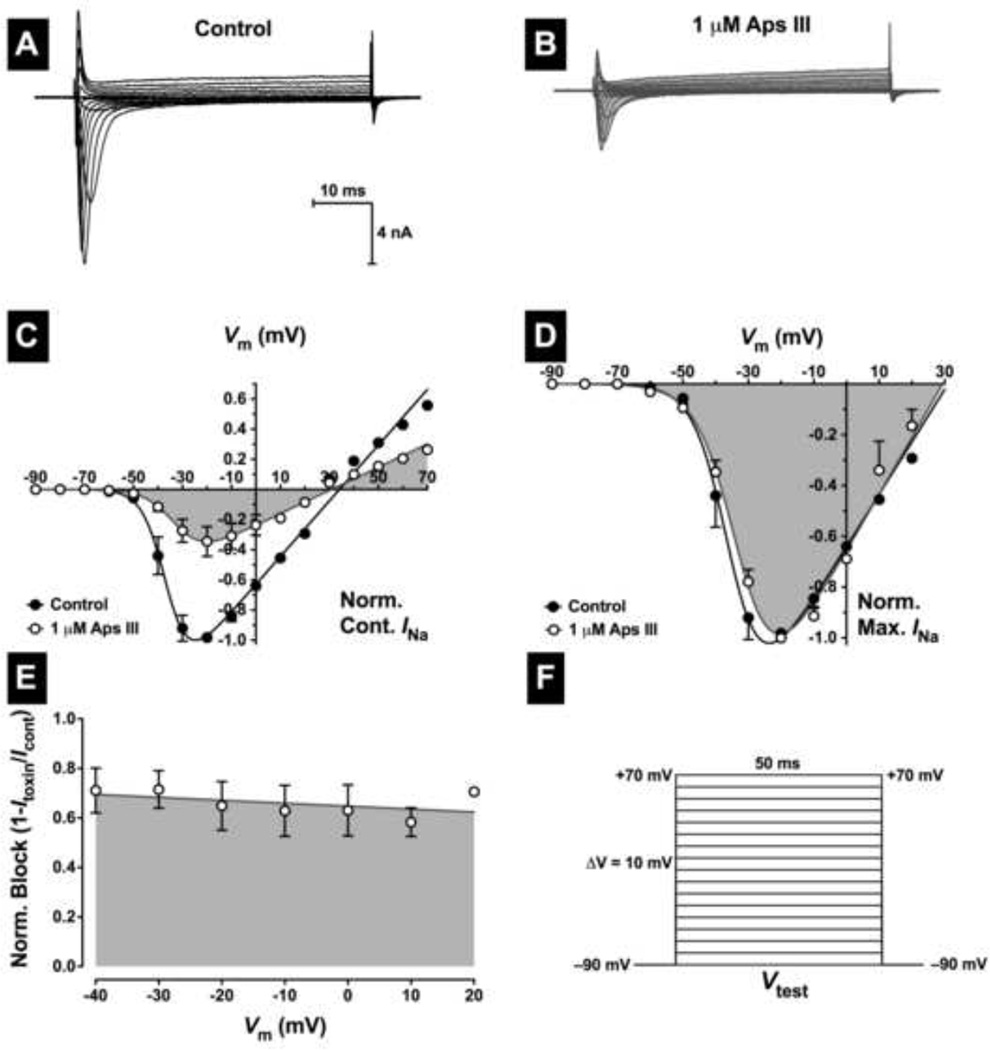
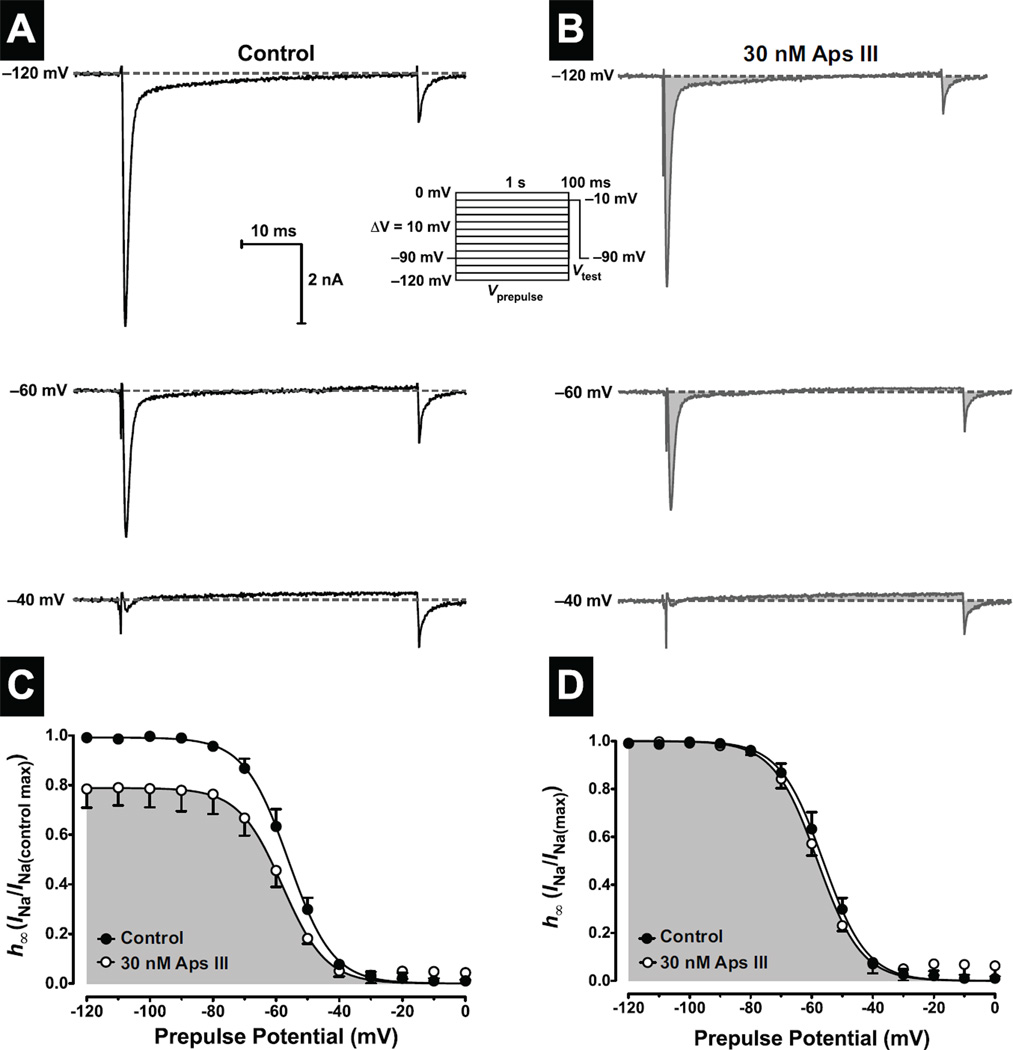
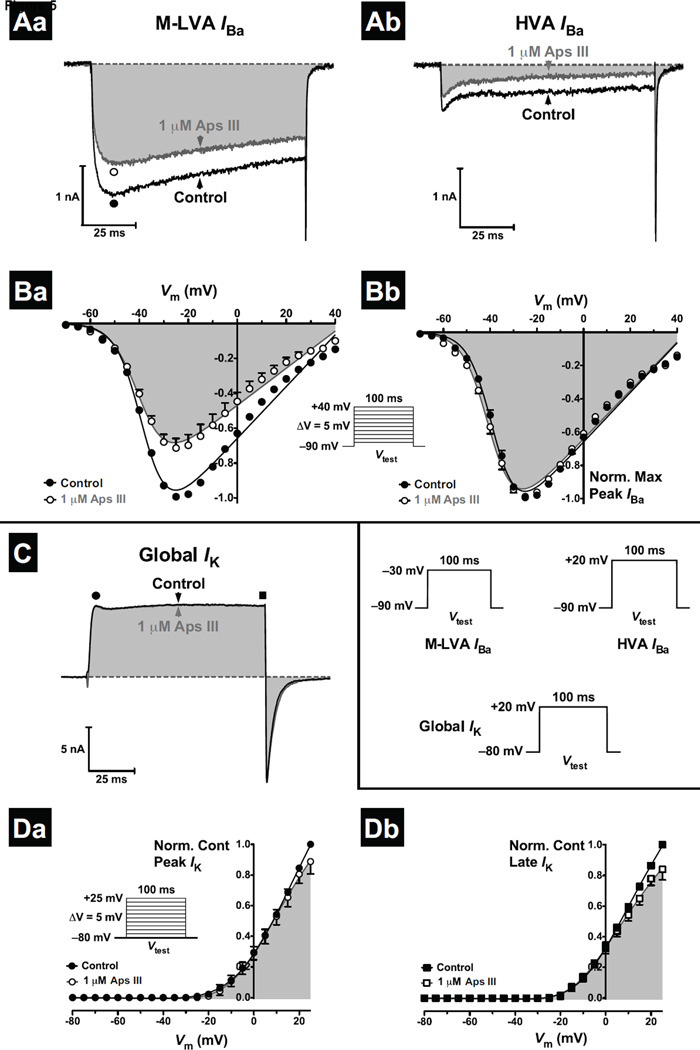
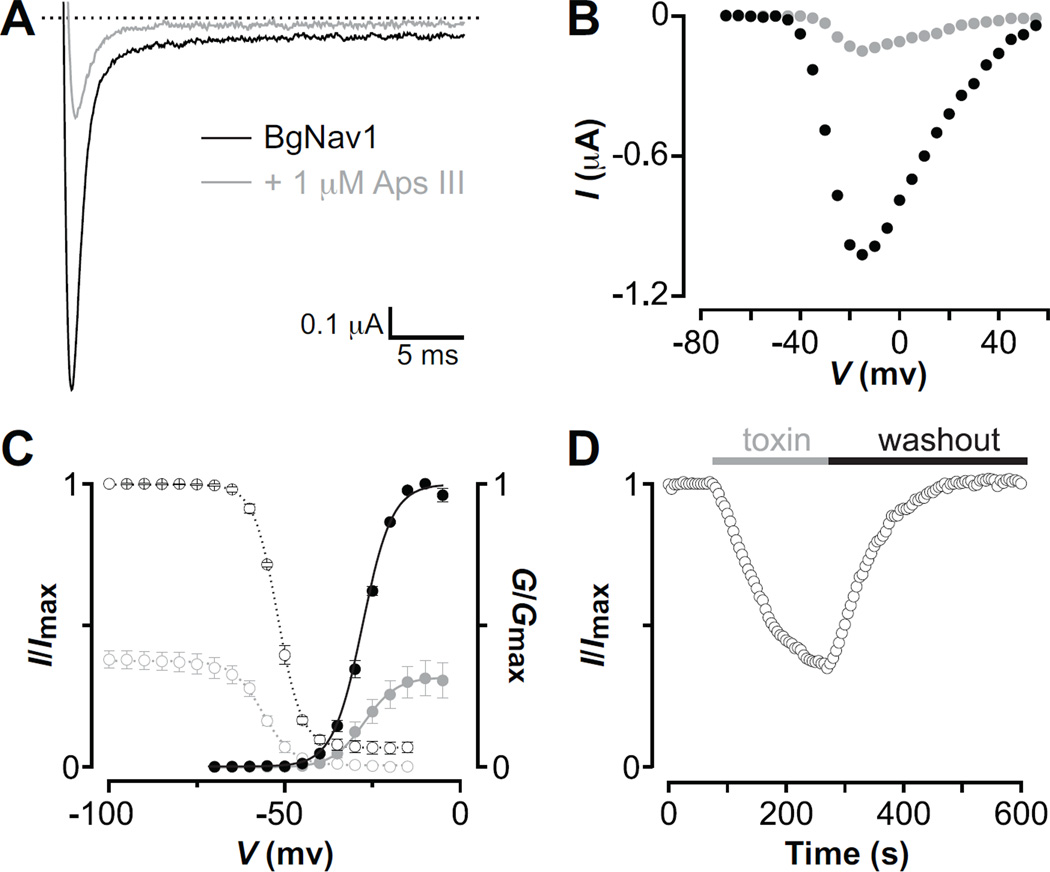
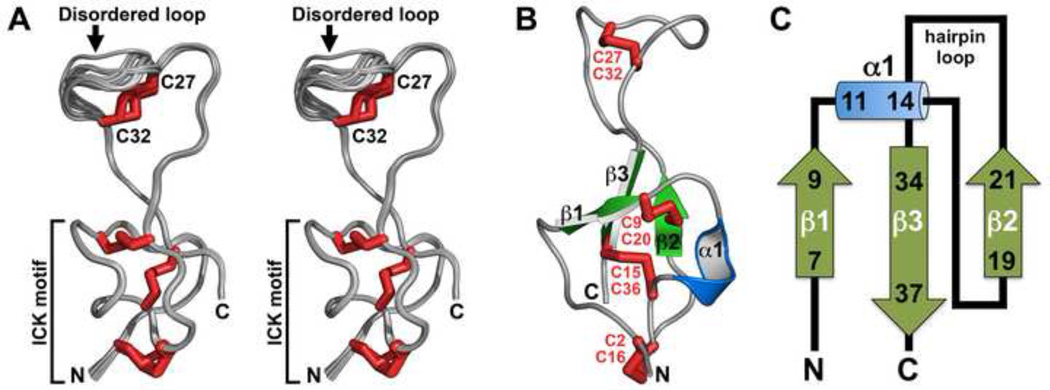
One of the most potent insecticidal venom peptides described to date is Aps III from the venom of the trapdoor spider Apomastus schlingeri. Aps III is highly neurotoxic to lepidopteran crop pests, making it a promising candidate for bioinsecticide development. However, its disulfide-connectivity, three-dimensional structure, and mode of action have not been determined. Here we show that recombinant Aps III (rAps III) is an atypical knottin peptide; three of the disulfide bridges form a classical inhibitor cystine knot motif while the fourth disulfide acts as a molecular staple that restricts the flexibility of an unusually large β hairpin loop that often houses the pharmacophore in this class of toxins. We demonstrate that the irreversible paralysis induced in insects by rAps III results from a potent block of insect voltage-gated sodium channels. Channel block by rAps III is voltage-independent insofar as it occurs without significant alteration in the voltage-dependence of channel activation or steady-state inactivation. Thus, rAps III appears to be a pore blocker that plugs the outer vestibule of insect voltage-gated sodium channels. This mechanism of action contrasts strikingly with virtually all other sodium channel modulators isolated from spider venoms that act as gating modifiers by interacting with one or more of the four voltage-sensing domains of the channel.


Conflict of interest statement

Conflict of interest

The authors declare that they have no conflicts of interest.

Figures

Fig. 1
Fig. 1. Production and functional analysis of recombinant Aps III
(A) Schematic representation of the pLicC-NSB1 vector used for periplasmic expression of Aps III. The coding region includes a MalE signal sequence (MalESS) for periplasmic export, a His6 affinity tag, an MBP fusion tag, and a codon-optimised gene encoding Aps III, with a TEV protease recognition site inserted between the MBP and toxin coding regions. The locations of key elements of the vector are shown, including the ribosome binding site (RBS). (B) Primary structure of rAps III. The non-native N-terminal Ser residue is highlighted in grey and the triglycine sequence is underlined. The disulfide framework of rAps III as determined in the current study is shown above the amino acid sequence. (C) SDS-PAGE gels illustrating different steps in the purification of rAps III. Lanes are as follows: M, molecular weight markers; lane 1, E. coli cell extract prior to IPTG induction; lane 2, E. coli cell extract after IPTG induction; lane 3, lysate resulting from cell disruption; lane 4, soluble periplasmic extract; lane 5, Ni-NTA beads after loading the cell lysate (the His6-MBP-Aps III fusion protein is evident at ~49 kDa); lane 6, eluate from washing Ni-NTA resin with loading buffer; lane 7, eluate from washing Ni-NTA resin with 10 mM imidazole; lane 8, eluate from washing Ni-NTA resin with 500 mM imidazole; lane 9, purified fusion protein before TEV cleavage; lane 10, fusion protein sample after TEV protease cleavage, showing complete cleavage of fusion protein to His6-MBP. (D) RP-HPLC chromatogram showing the final step in the purification of rAps III. The asterisk denotes the peak corresponding to correctly folded rAps III. Inset is a MALDI-TOF MS spectrum showing the [M+H]+ ion for the purified recombinant toxin (obs. = 3846.58 Da; calc. = 3846.49Da). (E) Dose-response curve for the paralytic effects of rAps III determined 24 h after injection into sheep blowflies (L. cuprina).
Fig. 2
Fig. 2. Effects of rAps III on NaV channels in cockroach DUM neurons
(Aa–c) Typical effects of increasing concentrations of rAps III on INa. Traces show superimposed control (black) and toxin (grey and shaded) current traces elicited by a 50-ms depolarising test pulse (Vtest) shown in panel D. The reduction in INa is highlighted in the inset of panels Aa–c. (B) Complete block of INa by 300 nM TTX, confirming that ionic currents are solely mediated through NaV channels. Dotted lines represent zero current. (C) Concentration-response relationship of rAps III to inhibit peak INa. The percentage block at increasing concentrations of rAps III were fitted with a logistic function (Eq. 1; see Materials and Methods). The median inhibitory concentration (IC50) was determined to be 540 nM. Data points are the mean ± SEM of 5–9 cells.
Fig. 3
Fig. 3. Effects of rAps III on the voltage-dependence of NaV channel activation in cockroach DUM neurons
Typical families of INa recorded prior to (A), and following (B), application of 1 µM rAps III. Nav channel currents were elicited by the test pulse protocol shown in panel F. (C–D) Normalised peak INa-V relationships. Currents recorded in the presence of 1 µM rAps III were normalised to the maximum inward INa in controls (C), or maximum inward INa (D). Data shows INa before (closed symbols), and after (open symbols and shaded), application of 1 µM rAps III. Data were fitted with Eq. 2 (see Materials and Methods). As can be seen in panel (D), no significant shifts in the voltage dependence of NaV channel activation were observed. (E) Fractional block of INa by 1 µM rAps III showing lack of voltage dependence. Normalised peak INa in the presence of toxin were calculated as a fraction of peak control INa and plotted against the test potential. Data were taken from panel C and fitted using linear regression. All data are expressed as the mean ± SEM of 4 cells.
Fig. 4
Fig. 4. Effects of rAps III on steady-state NaV channel inactivation (h)
Steady-state inactivation was determined using a two-pulse protocol (see inset). (A–B) Typical peak INa recorded during the test pulse (Vtest) are shown following 1-s prepulse potentials (Vprepulse) to −120 mV, −60 mV and −40 mV recorded before (left-hand traces), and following (right-hand shaded traces), perfusion with 30 nM rAps III. Dotted lines represent zero current. (C–D) Peak INa, recorded during Vtest were expressed as a fraction of maximum control INa (C), or normalised to peak INa amplitude (D), and plotted against prepulse potential. Panels show the proportion of INa that is available for activation under control conditions (closed circles), and during perfusion with 30 nM rAps III (open circles and shaded). The h/V curves were fitted with Eq. 3 (see Materials and Methods). All data are expressed as the mean ± SEM of 3 cells.
Fig. 5
Fig. 5. Effect of rAps III on KV and CaV channel currents in cockroach DUM neurons
(A) Whole-cell M-LVA and HVA IBa in the absence (black traces), and presence (dark grey and shaded traces), of 1 µM rAps III. M-LVA and HVA IBa were activated by a 100 ms Vtest to −30 mV and +20 mV, respectively, as shown in the inset in panel C. Perfusion with 1 µM rAps III partially blocked M-LVA (Aa) and HVA (Ab) CaV channel currents. Dotted lines represent zero current. (B) Effects of 1 µM rAps III on the voltage-dependence of CaV channel activation. Families of CaV channel currents were generated by the Vtest protocol shown in the inset of panel C. Currents recorded in the presence of 1 µM rAps III were normalised to the maximum inward IBa in control (Ba) or maximum inward IBa in toxin (Bb). IBa-V relationships show current recorded before (closed circles), and after (open circles and shaded), perfusion with 1 µM rAps III. Normalised I–V relationships were fitted using Eq. 2. (C) Typical superimposed global IK recorded prior to (black traces), and following (dark grey and shaded traces), application of 1 µM rAps III. Currents were generated by 100-ms depolarising test pulses (Vtest) as shown in the as shown in the inset in panel C. (D) Effects of rAps III on the voltage-dependence of global KV channel activation. Families of outward IK were recorded before (closed circles), and after (open circles and shaded), application of 1 µM rAps III. Families of IK were generated by the Vtest protocol shown in the inset of panel C. Global IK-V relationships show effects of the toxin on peak (Da) and late (Db) global IK. Late currents were measured at 100 ms. All data are expressed as the mean ± SEM of 4 cells.
Fig. 6
Fig. 6. rAps III inhibits BgNaV1-mediated sodium currents
(A) Inhibition of BgNaV1-mediated sodium currents by 1 µM rAps III at a depolarization to −20 mV from a holding voltage of −90 mV. (B) Representative INa-V relationship for BgNaV1 before (black) and after (grey) addition of 1 µM rAps III. Currents were elicited by 5-mV step depolarizations from a holding voltage of −90 mV. (C) Comparison of the gating properties of BgNaV1 before (black) and after (grey) addition of 1 µM rAps III. Shown are the deduced conductance (G)–voltage (filled circles) and steady-state inactivation (open circles) relationships. Error bars denote SEM, with n = 3 cells. (D) Onset of BgNaV1-mediated INa inhibition by 1 µM rAps III at depolarizations to −20 mV (holding voltage was −90 mV) followed by a complete recovery after toxin washout.
Fig. 7
Fig. 7. Three-dimensional structure of rAps III
(A) Stereoview of an overlay of the ensemble of 20 rAps III structures. Disulfide bonds are highlighted in red and the N- and C-termini are labelled. The structures are overlaid over the backbone atoms of residues 2–27 and 32–38 in order to highlight the disordered nature of the triglycine loop (residues 27–32) relative to the well-structured ICK region of the toxin. (B) Ribbon representation of the rAps III structure highlighting the various secondary structure elements and disulfide bonds. The views in panels (B) and (C) are related by a ~180° rotation around the long axis of the molecule. (C) Topology map of the secondary structure of rAps III. The N- and C-termini are labelled.

References

    1. Tedford HW, Sollod BL, Maggio F, King GF. Australian funnel-web spiders: master insecticide chemists. Toxicon. 2004;43:601–618. - PubMed
    1. World Health Organization. World Malaria Report. Geneva, Switzerland: WHO Press; 2009.
    1. Oerke EC. Crop losses to pests. J Agric Sci. 2006;144:31–43.
    1. Pimental D. Pesticides and pest control. In: Peshin R, Dhawan AK, editors. Integrated pest management: innovation-development process. Dordrecht: Springer Verlag; 2009. pp. 83–87.
    1. Tedford HW, Gilles N, Ménez A, Doering CJ, Zamponi GW, King GF. Scanning mutagenesis of ω-atracotoxin-Hv1a reveals a spatially restricted epitope that confers selective activity against invertebrate calcium channels. J Biol Chem. 2004;279:44133–44140. - PubMed

Publication types

MeSH terms