

Association of intradialytic blood pressure variability with increased all-cause and cardiovascular mortality in patients treated with long-term hemodialysis
- PMID: 23474007
- PMCID: PMC3660473
- DOI: 10.1053/j.ajkd.2012.12.023
Association of intradialytic blood pressure variability with increased all-cause and cardiovascular mortality in patients treated with long-term hemodialysis
Abstract
Background: Blood pressure is known to fluctuate widely during hemodialysis; however, little is known about the association between intradialytic blood pressure variability and outcomes.
Study design: Retrospective observational cohort.
Setting & participants: A random sample of 6,393 adult, thrice-weekly, in-center, maintenance hemodialysis patients dialyzing at 1,026 dialysis units within a single large dialysis organization.
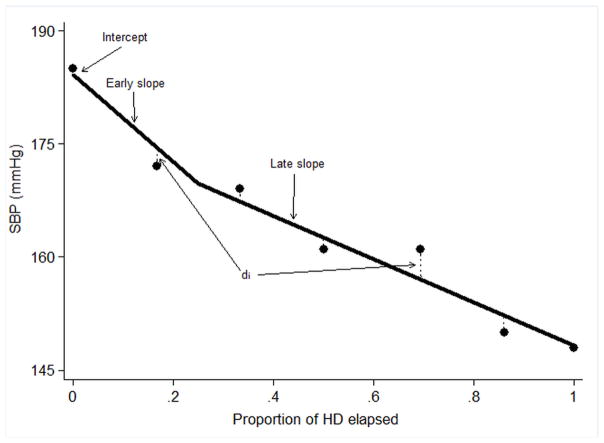
Predictor: Intradialytic systolic blood pressure (SBP) variability. This was calculated using a mixed linear effects model. Peridialytic SBP phenomena were defined as starting SBP (regression intercept), systematic change in SBP over the course of dialysis (2 regression slopes), and random intradialytic SBP variability (absolute regression residual).
Outcomes: All-cause and cardiovascular mortality.
Measurements: SBPs (n = 631,922) measured during hemodialysis treatments (n = 78,961) during the first 30 days in the study. Outcome data were obtained from the dialysis unit electronic medical record and were considered beginning on day 31.
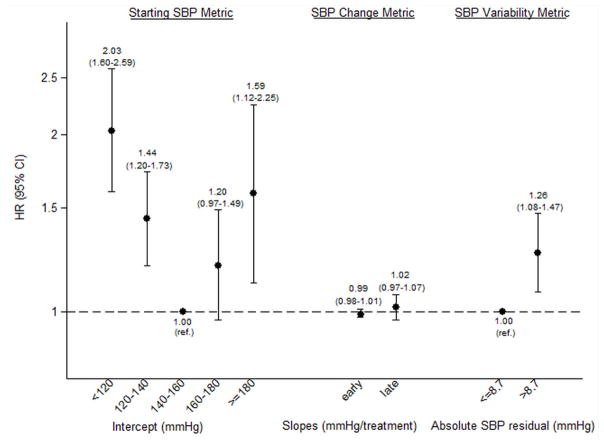
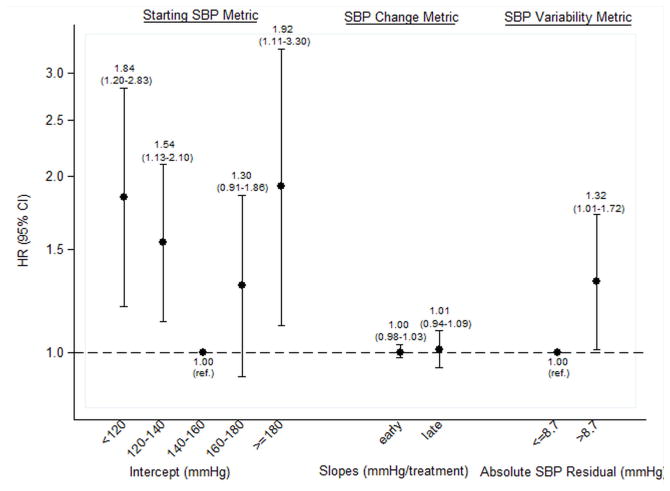
Results: High (ie, greater than the median) versus low SBP variability was associated with greater risk of all-cause mortality (adjusted HR, 1.26; 95% CI, 1.08-1.47). The association between high SBP variability and cardiovascular mortality was even more potent (adjusted HR, 1.32; 95% CI, 1.01-1.72). A dose-response trend was observed across quartiles of SBP variability for both all-cause (P = 0.001) and cardiovascular (P = 0.04) mortality.
Limitations: Inclusion of patients from a single large dialysis organization, over-representation of African Americans and patients with diabetes and heart failure, and lack of standardized SBP measurements.
Conclusions: Greater intradialytic SBP variability is associated independently with increased all-cause and cardiovascular mortality. Further prospective studies are needed to confirm findings and identify means of reducing SBP variability to facilitate randomized study.
Copyright © 2013 National Kidney Foundation, Inc. Published by Elsevier Inc. All rights reserved.
Figures
References
-
- Weiner DE, Tighiouart H, Amin MG, et al. Chronic kidney disease as a risk factor for cardiovascular disease and all-cause mortality: a pooled analysis of community-based studies. J Am Soc Nephrol. 2004 May;15(5):1307–15. - PubMed
-
- Foley RN, Parfrey PS, Sarnak MJ. Clinical epidemiology of cardiovascular disease in chronic renal disease. Am J Kidney Dis. 1998 Nov;32(5 Suppl 3):S112–9. - PubMed
-
- Zager PG, Nikolic J, Brown RH, et al. “U” curve association of blood pressure and mortality in hemodialysis patients. Medical Directors of Dialysis Clinic, Inc. Kidney Int. 1998 Aug;54(2):561–9. - PubMed
-
- Port FK, Hulbert-Shearon TE, Wolfe RA, et al. Predialysis blood pressure and mortality risk in a national sample of maintenance hemodialysis patients. Am J Kidney Dis. 1999 Mar;33(3):507–17. - PubMed
Publication types
MeSH terms
Grants and funding
LinkOut - more resources
Full Text Sources
Other Literature Sources
Medical
