. 2013 Nov 14;32(46):5359-68.
doi: 10.1038/onc.2013.40. Epub 2013 Mar 11.

Aberrant Mer receptor tyrosine kinase expression contributes to leukemogenesis in acute myeloid leukemia

Affiliations
Free PMC article

Aberrant Mer receptor tyrosine kinase expression contributes to leukemogenesis in acute myeloid leukemia

A B Lee-Sherick et al. Oncogene. .
Free PMC article

Erratum in

Abstract

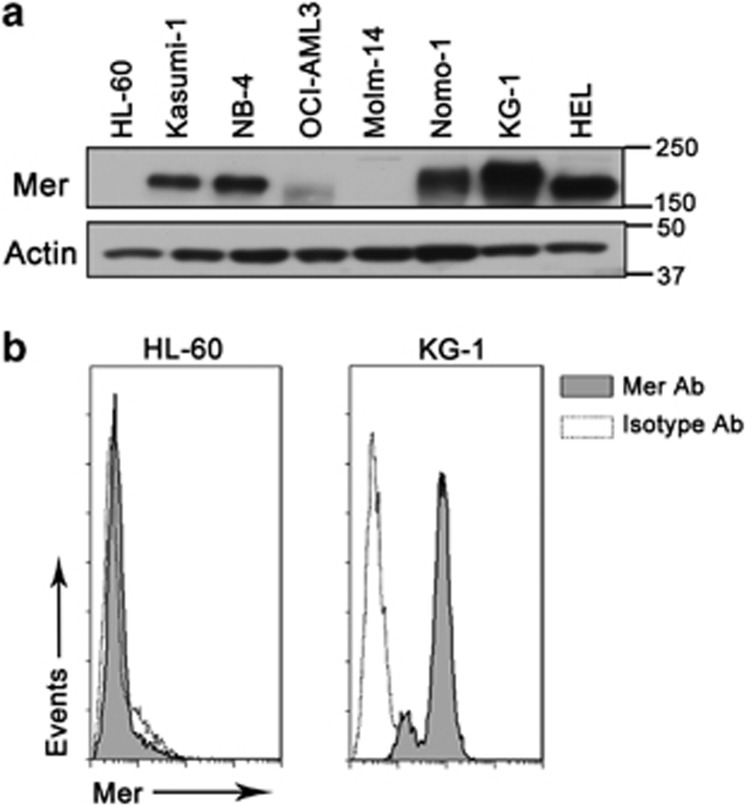
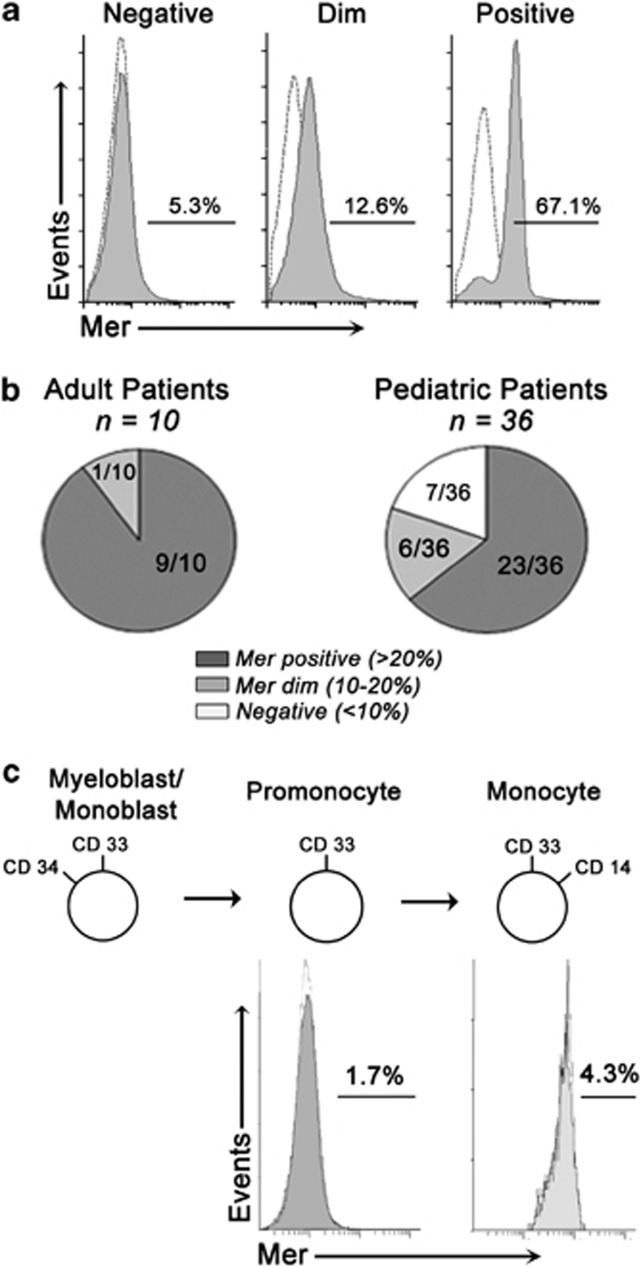
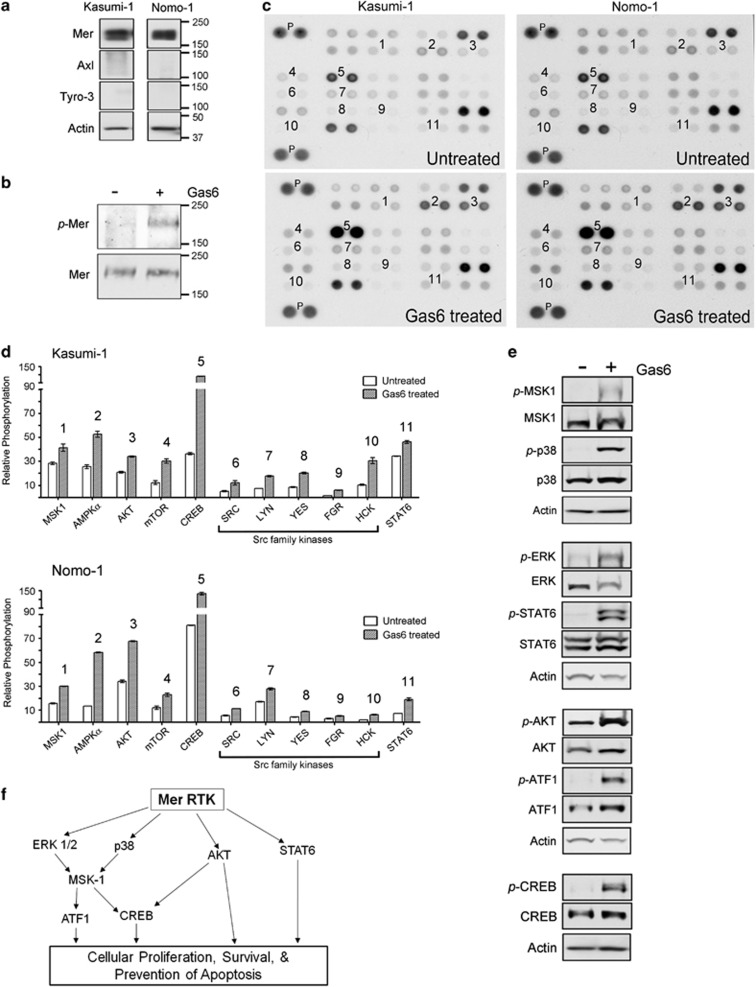
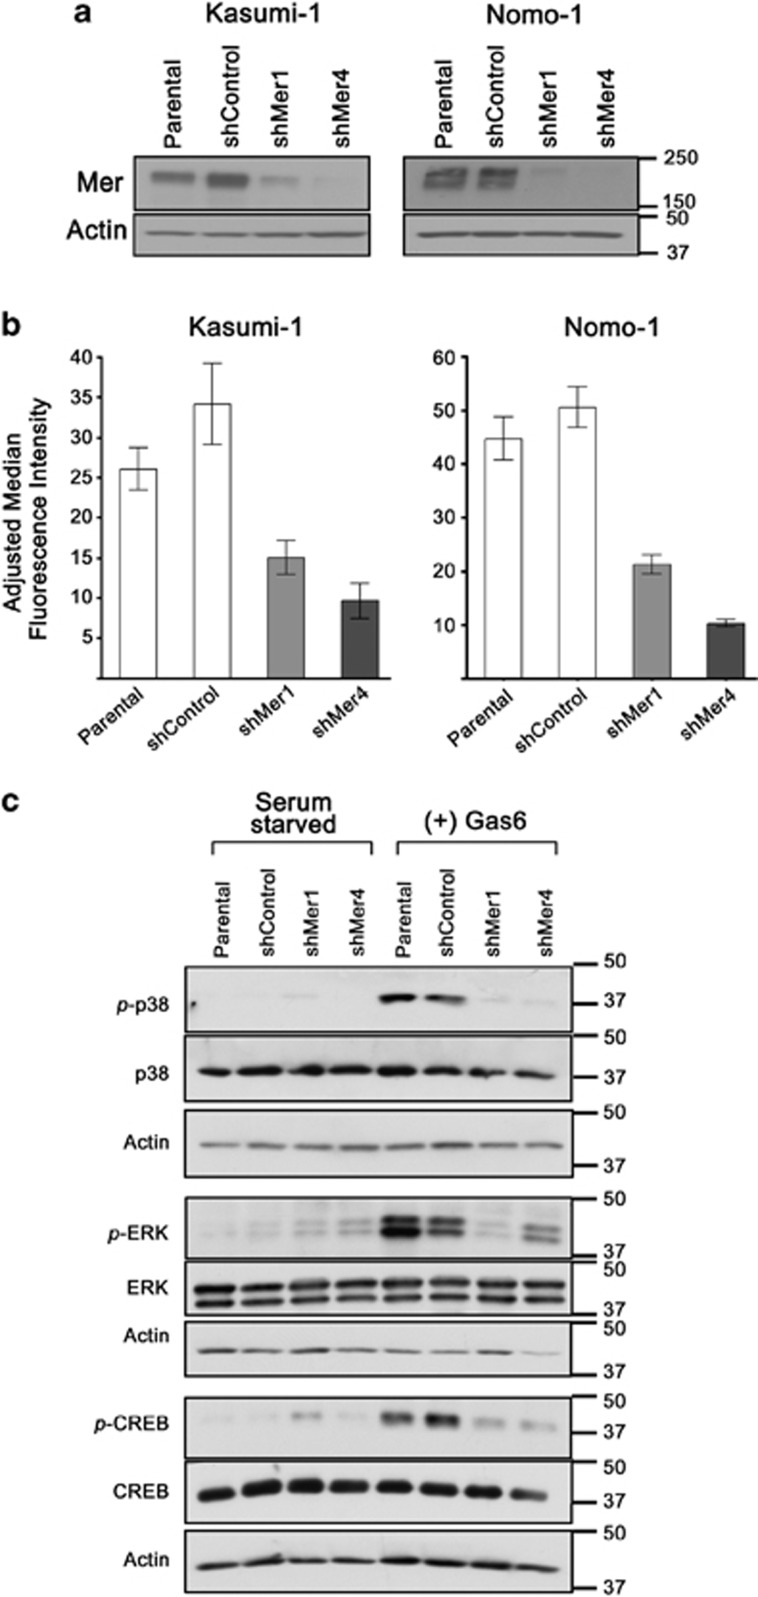
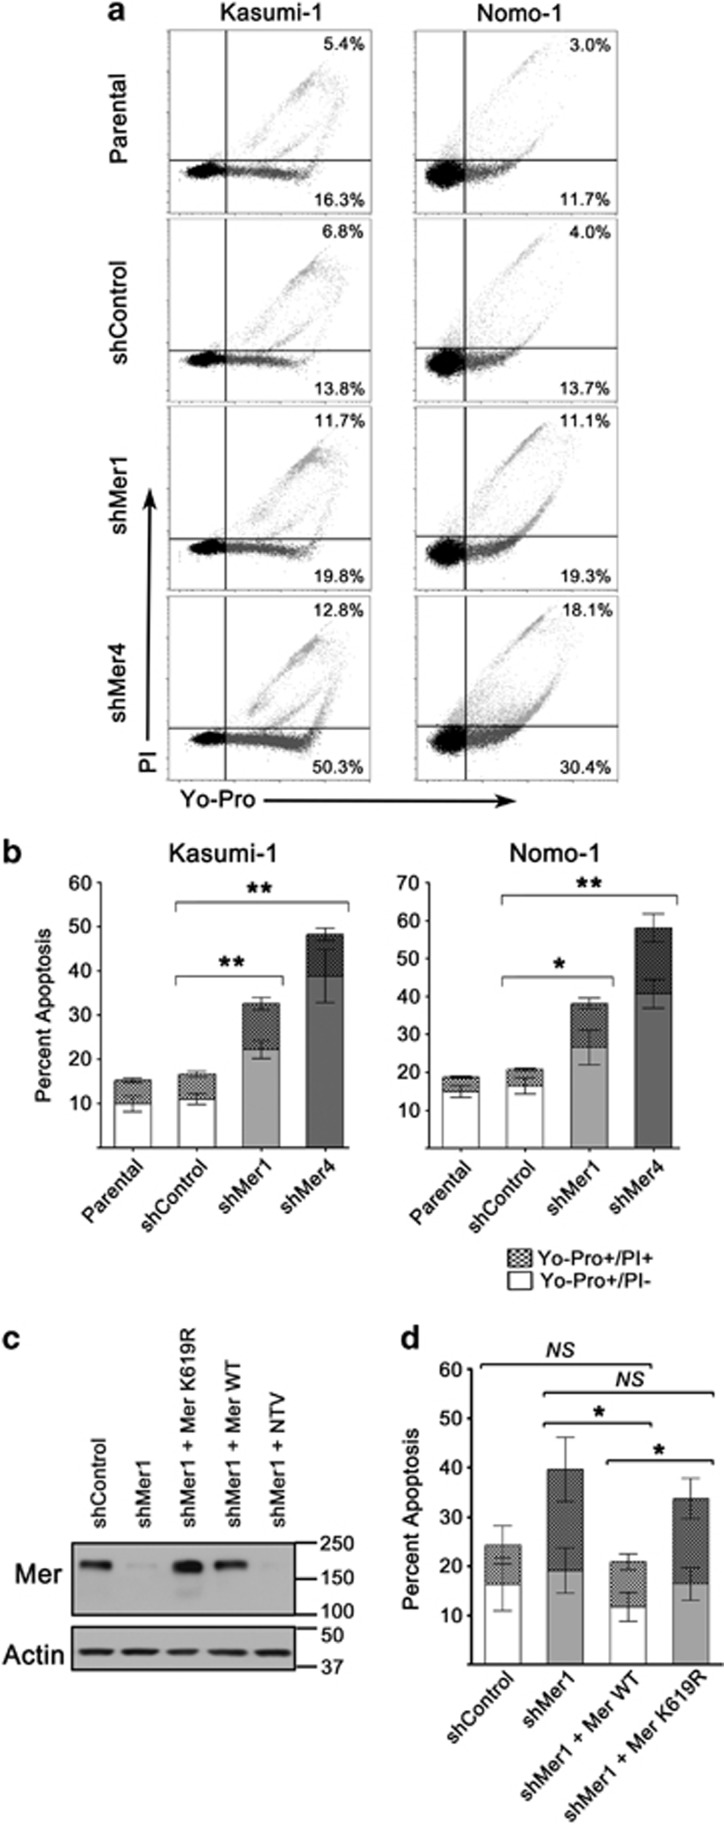
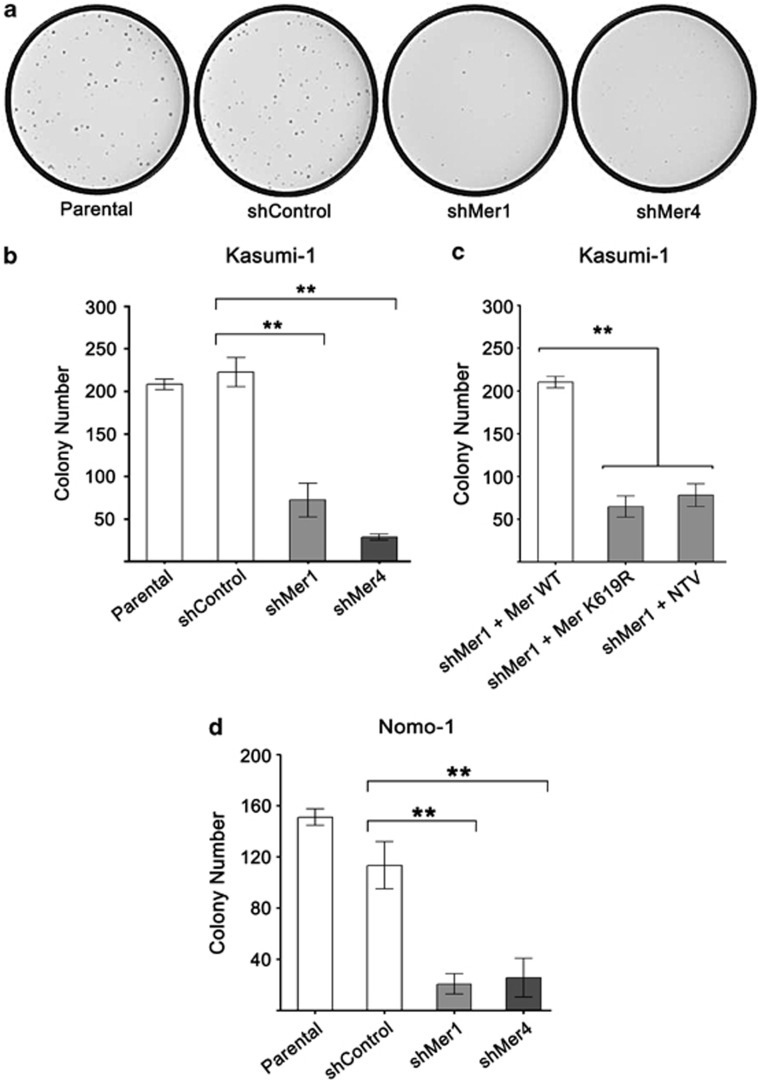
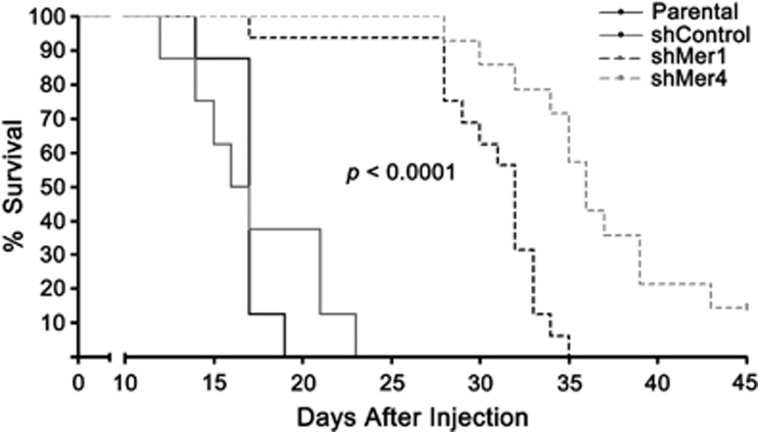
Acute myeloid leukemia (AML) continues to be extremely difficult to treat successfully, and the unacceptably low overall survival rates mandate that we assess new potential therapies to ameliorate poor clinical response to conventional therapy. Abnormal tyrosine kinase activation in AML has been associated with poor prognosis and provides strategic targets for novel therapy development. We found that Mer receptor tyrosine kinase was over-expressed in a majority of pediatric (29/36, 80%) and adult (10/10, 100%) primary AML patient blasts at the time of diagnosis, and 100% of patient samples at the time of relapse. Mer was also found to be expressed in 12 of 14 AML cell lines (86%). In contrast, normal bone marrow myeloid precursors expressed little to no Mer. Following AML cell line stimulation with Gas6, a Mer ligand, we observed activation of prosurvival and proliferative signaling pathways, including phosphorylation of ERK1/2, p38, MSK1, CREB, ATF1, AKT and STAT6. To assess the phenotypic role of Mer in AML, two independent short-hairpin RNA (shRNA) constructs were used to decrease Mer expression in the AML cell lines Nomo-1 and Kasumi-1. Reduction of Mer protein levels significantly increased rates of myeloblast apoptosis two to threefold in response to serum starvation. Furthermore, myeloblasts with knocked-down Mer demonstrated decreased colony formation by 67-87%, relative to control cell lines (P<0.01). NOD-SCID-gamma mice transplanted with Nomo-1 myeloblasts with reduced levels of Mer had a significant prolongation in survival compared with mice transplanted with the parental or control cell lines (median survival 17 days in parental and control cell lines, versus 32-36 days in Mer knockdown cell lines, P<0.0001). These data suggest a role for Mer in acute myeloid leukemogenesis and indicate that targeted inhibition of Mer may be an effective therapeutic strategy in pediatric and adult AML.


Figures

Figure 1
Figure 1
Mer is expressed in AML cell lines. (a) Whole-cell lysates derived from AML cell lines were subjected to immunoblot analysis with an anti-Mer antibody. This representative blot shows detection of the Mer protein (150–180 kD) in several AML cell lines. Actin was detected as a loading control. (b) Cell surface expression of Mer was determined by flow cytometry after staining with an anti-human Mer primary antibody and a PE-conjugated secondary antibody (gray histogram). Non-specific staining was determined using an IgG1 isotype control primary antibody and PE-conjugated secondary antibody (white histogram). Representative Mer negative (HL-60) and Mer positive (KG-1) cell lines are shown.
Figure 2
Figure 2
Mer is expressed in a majority of diagnostic bone marrow samples derived from patients with AML, but not in normal bone marrow. Myeloblasts collected at diagnosis from patients with AML were analyzed by flow cytometry for Mer expression. (a) Cells that expressed human CD33 and CD45 were analyzed after staining with a mouse anti-human Mer antibody and PE-conjugated secondary antibody to determine Mer expression (gray histogram). Non-specific staining was determined using a mouse IgG1 isotype control antibody and PE-conjugated secondary antibody (white histogram). Representative flow cytometry profiles for Mer-positive (>20% cells positive), Mer-dim (10–20% cells positive) and Mer-negative (<10% cells positive) patient samples are shown. (b) Graphic representation showing the fractions of Mer-positive, Mer-dim and Mer-negative pediatric (right panel) and adult (left panel) diagnostic primary patient samples. (c) Bone marrow samples from eight healthy donors were evaluated by flow cytometry for Mer RTK expression as described above. Myeloid progenitor populations were identified by gating on the cell surface markers noted in the figure. The fractions of cells expressing Mer in progenitor populations are shown. Myelo/monoblastic populations could not be quantified, due to low-cell number.
Figure 3
Figure 3
Mer stimulation in AML cells activates oncogenic signaling pathways. (a) Immunoblot analysis of Kasumi-1 and Nomo-1 cell lines confirmed they were positive for Mer (∼180 kD), but negative for other Tyro-3/Axl/Mer family tyrosine kinases Axl (140 kD) and Tyro-3 (140 kD). (b) Kasumi-1 and Nomo-1 cells were incubated in serum-free RPMI medium then treated with 200 nM rhGas6 (Gas6 treated) or buffer (Untreated). Immunoprecipitate analysis demonstrating phosphorylation of Mer after 200 nM Gas6 treatment (+) compared with treatment with buffer (−). Total Mer was used as a loading control. (c) Similarly treated diluted lysates were incubated with human phospho-kinase array membranes and bound phospho-proteins were detected according to kit instructions. Each membrane contains positive control (P) antibodies spotted in duplicate. Proteins which demonstrated a 1.5-fold or greater increase in phosphorylation after stimulation with Gas6 (Gas6 treated) relative to buffer treated (Untreated) are marked by numbers between duplicate spots, which correlate with the identification numbers shown in (d). (d) Levels of the indicated phospho-proteins were quantified after normalizing pixel density of each positive control to 100. Untreated samples are denoted in white, and Gas6 treated cells are denoted in gray hatched lines, showing the difference in relative phosphorylation between the two conditions. Each bar represents the mean±s.e. of duplicate spots. Increases were found in levels of phosphorylated MSK1 (S376/S360), AMPKα (T174), AKT (S473), mTOR (S2448), CREB (S133), SRC family kinases SRC (Y419), LYN (Y397), YES (Y426), FGR (Y412) and HCK (Y411) and STAT6 (Y641). (e) Kasumi-1 and Nomo-1 cells were incubated in serum-free media for 2–3 h followed by treatment with 200 nM rhGas6 (+) or buffer (−). Whole-cell lysates were subjected to immunoblot analysis with antibodies specific for the phosphorylated and total MSK1, p38, ERK1/2, STAT6, AKT, ATF1 and CREB proteins. Representative Nomo-1 immunoblot shown here. (f) Oncogenic downstream signaling pathways found to be activated in Mer-positive AML cells following stimulation with Gas6.
Figure 4
Figure 4
Mer protein expression is reduced by shRNA expression in AML cell lines. Kasumi-1 and Nomo-1 cells were infected with lentiviral particles containing short hairpin RNA (shRNA) constructs targeting Mer (shMer1, shMer4), or GFP as a non-silencing control (shControl). Knockdown of Mer was confirmed by (a) immunoblot analysis of whole-cell lysates and (b) flow cytometry using anti-Mer antibody. Values represent means and s.e. derived from three independent experiments. (c) Kasumi-1 and Nomo-1 parental and shRNA containing cells were incubated in serum-free media for 2–3h followed by a 10 min treatment with 200 nM rhGas6 ((+) Gas6) or buffer (Serum Starved). Whole-cell lysates were subjected to immunoblot analysis with antibodies specific for the phosphorylated and total proteins analyzed in Figure 3e. Of those, p38, ERK1/2, and CREB consistently demonstrated decreased phosphorylation corresponding to level of Mer, when stimulated with Gas6.
Figure 5
Figure 5
Mer knockdown confers susceptibility to apoptosis. (a) Parental, non-silencing control shRNA (shControl) and Mer knockdown (shMer1, shMer4) Kasumi-1 and Nomo-1 cells were serum starved or cultured in complete medium for 18 h before staining with propidium iodide and Yo-Pro-1 iodide. Apoptotic cells were identified by flow cytometry. Representative flow cytometry profiles are shown. The percentages of early apoptotic (lower right quadrant; Yo-Pro+/PI−) and late apoptosis/necrosis (upper right quadrant; Yo-Pro+/PI+) cells are shown. (b) Cumulative data demonstrate a significant accumulation of apoptotic cells in Kasumi-1 and Nomo-1 cells when Mer is inhibited by shRNA knockdown (*P<0.05 and **P<0.01 versus shControl). No significant differences between parental and shControl cells were observed. (c) Reintroduction of WT Mer into Kasumi-1 shMer1 knockdown cells rescues Mer protein level after knockdown (shMer1+Mer WT). Additional control cell lines were generated by transduction of a gene for a kinase mutant Mer (shMer1+Mer K619R), which maintains the extracellular epitope that binds the anti-Mer antibody, or a non-targeting vector (shMer1+NTV) into Kasumi-1 shMer1 cells. Representative immunoblot of Mer protein levels shown here. (d) Apoptosis of Kasumi-1 WT add-back (shMer1+Mer WT) and mutant Mer add-back (shMer1+Mer K619R) cells were analyzed in comparison to shControl and shMer1 cells after serum starvation as described above. Mer WT add-back rescues myeloblast ability to stave off apoptosis comparable to shControl cell lines (NS=not significant compared to shControl, *P=0.05 compared with shMer1 and shMer1+K619R). Mean values and s.e. derived from at least three independent experiments are shown.
Figure 6
Figure 6
Mer knockdown decreases AML colony forming potential. Parental, non-silencing control shRNA (shControl), and Mer knockdown (shMer1, shMer4) Nomo-1 and Kasumi-1 cells were cultured in methylcellulose for 13 days. (a) Images of representative plates from the Nomo-1 cell line are shown. (b and d) Total colony number was determined demonstrating a statistically significant decrease in colony formation when Mer is inhibited (**P<0.01). (c) When Mer is reintroduced into shMer1 cells, colony forming potential is restored to shControl levels seen in (b) (difference not significant), which does not occur when Mer K619R mutant (shMer1+Mer K619R) or non-targeting vector (shMer1+NTV) are introduced into shMer1 cells (**P<0.01). Mean values and s.e. derived from at least three independent experiments are shown.
Figure 7
Figure 7
Inhibition of Mer expression prolongs survival in a murine model of AML. NOD-SCID-gamma mice were radiated with 200 cGy and transplanted with five million Nomo-1 parental (Parental, n=8), non-targeting shRNA (shControl, n=8) or Mer knockdown (shMer1 n=16, shMer4 n=14) cells by intravenous injection. Kaplan–Meier analysis comparing survival is shown demonstrating a statistically significant prolongation (P<0.001) in symptom-free survival in mice injected with Mer knockdown cells compared with parental and shControl cells. No significant differences between parental and shControl cells were observed. Median survival was 17 days for mice injected with parental and shControl cells, compared with 32 days for mice injected with shMer1-expressing cells and 36 days for mice injected with shMer4-expressing cells.

References

    1. Pulte D, Gondos A, Brenner H. Expected long-term survival of patients diagnosed with acute myeloblastic leukemia during 2006-2010. Ann Oncol. 2010;21:335–341. - PubMed
    1. Pui CH, Carroll WL, Meshinchi S, Arceci RJ.Biology, risk stratification, and therapy of pediatric acute leukemias: an update J Clin Oncolofficial journal of the American Society of Clinical Oncology201129551–565. - PMC - PubMed
    1. Pfirrmann M, Ehninger G, Thiede C, Bornhauser M, Kramer M, Rollig C, et al. Prediction of post-remission survival in acute myeloid leukaemia: a post-hoc analysis of the AML96 trial. Lancet Oncol. 2012;13:207–214. - PubMed
    1. Sander A, Zimmermann M, Dworzak M, Fleischhack G, von Neuhoff C, Reinhardt D, et al. Consequent and intensified relapse therapy improved survival in pediatric AML: results of relapse treatment in 379 patients of three consecutive AML-BFM trials. Leukemia. 2010;24:1422–1428. - PubMed
    1. Trifilio SM, Rademaker AW, Newman D, Coyle K, Carlson-Leuer K, Mehta J, et al. Mitoxantrone and etoposide with or without intermediate dose cytarabine for the treatment of primary induction failure or relapsed acute myeloid leukemia. Leuk Res. 2012;36:394–396. - PubMed

Publication types

MeSH terms

Substances