. 2013 Apr 3;32(7):938-53.
doi: 10.1038/emboj.2013.31. Epub 2013 Mar 8.

Oct4 switches partnering from Sox2 to Sox17 to reinterpret the enhancer code and specify endoderm

Affiliations

Oct4 switches partnering from Sox2 to Sox17 to reinterpret the enhancer code and specify endoderm

Irene Aksoy et al. EMBO J. .

Abstract

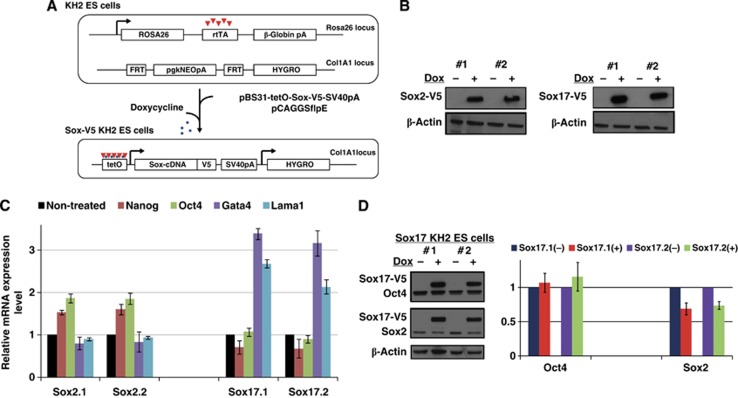
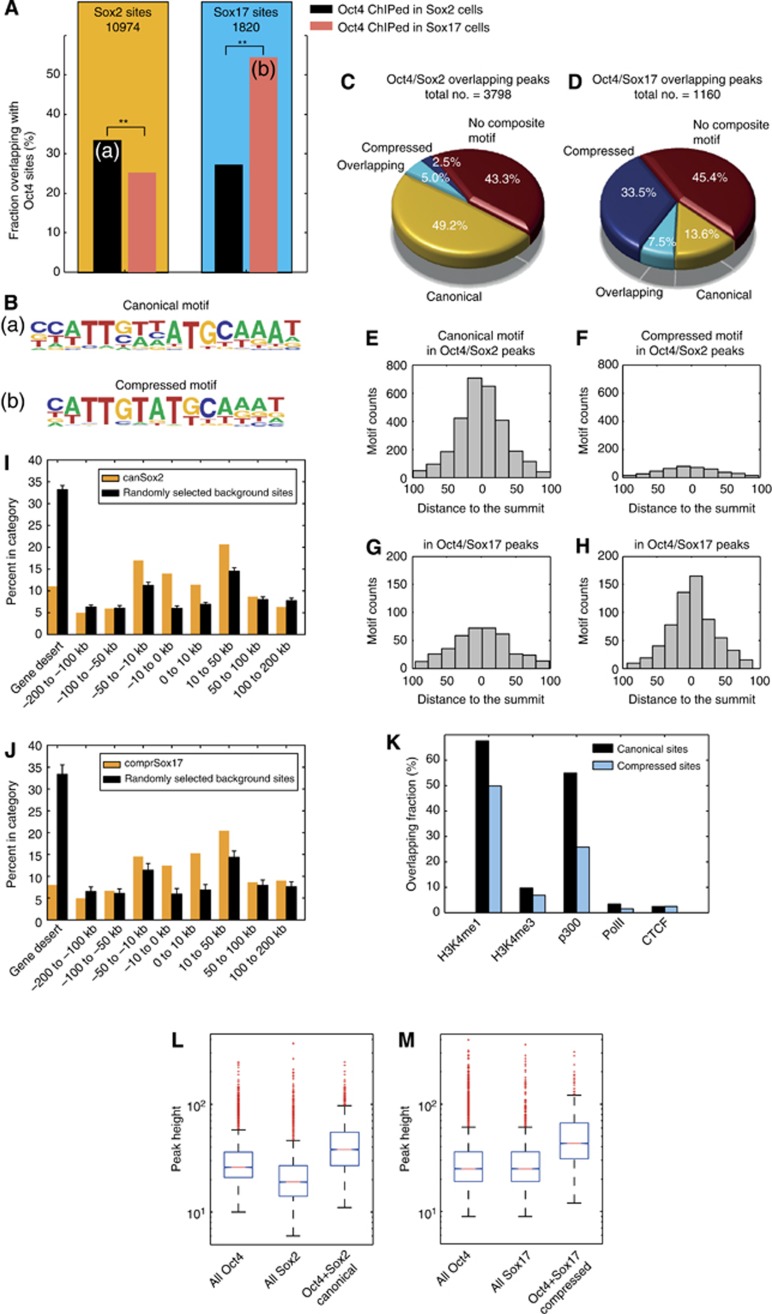
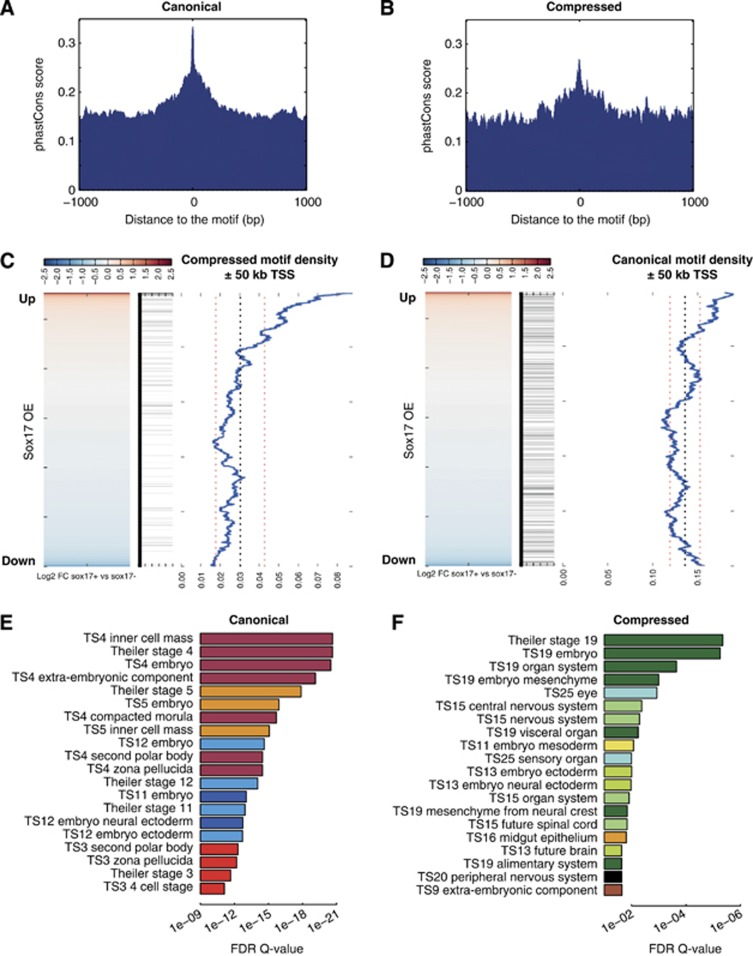
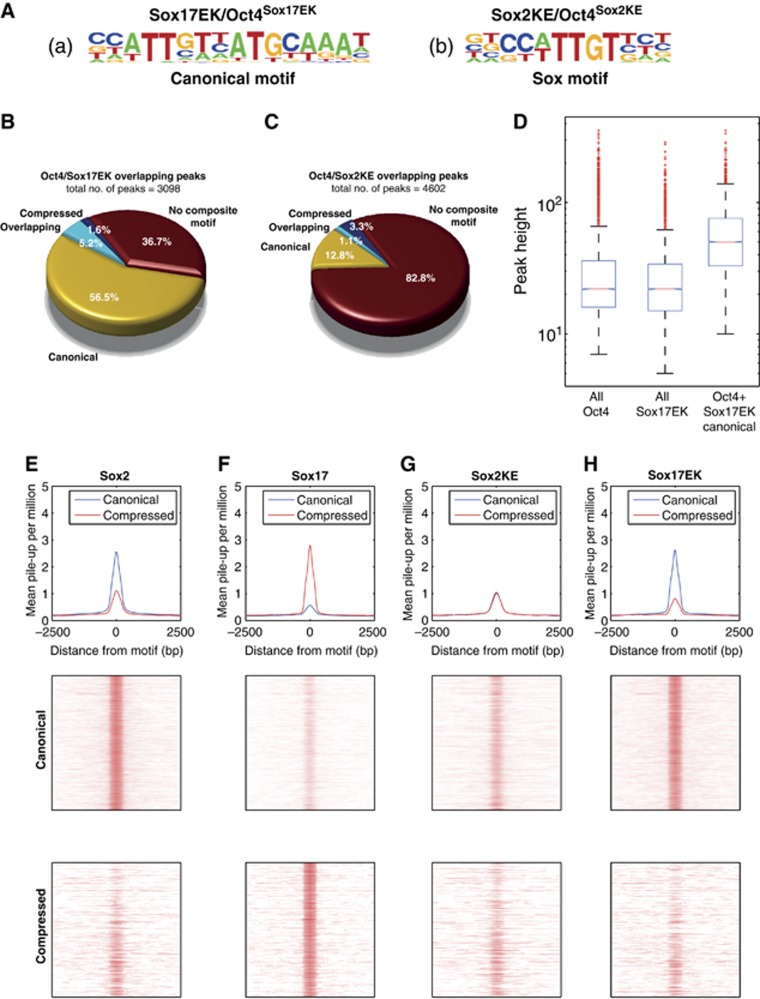
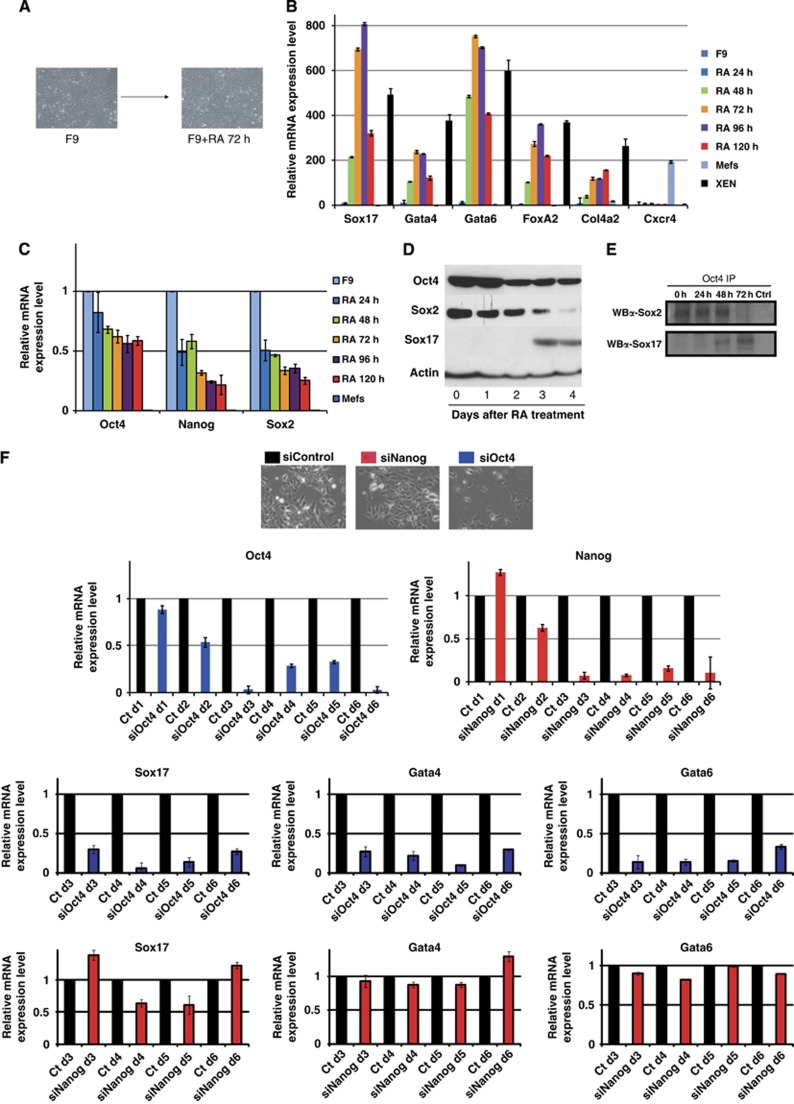
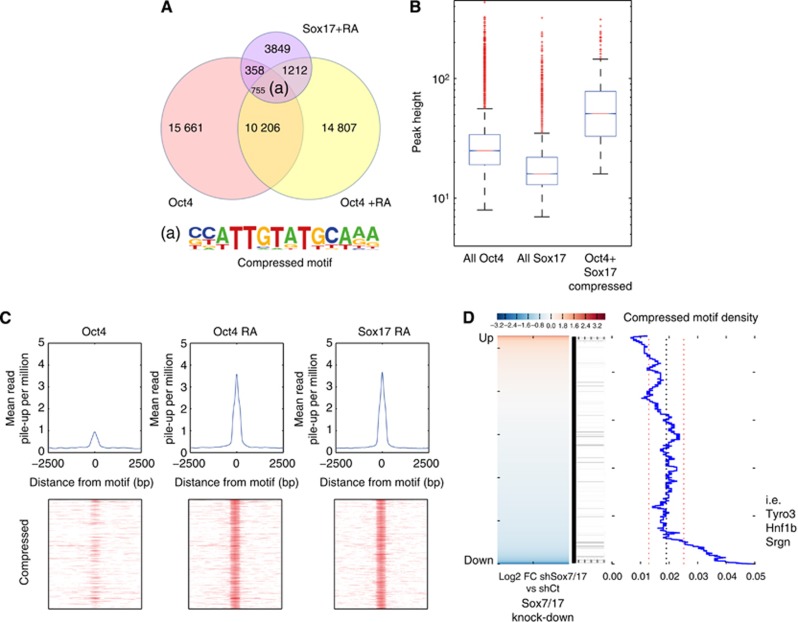
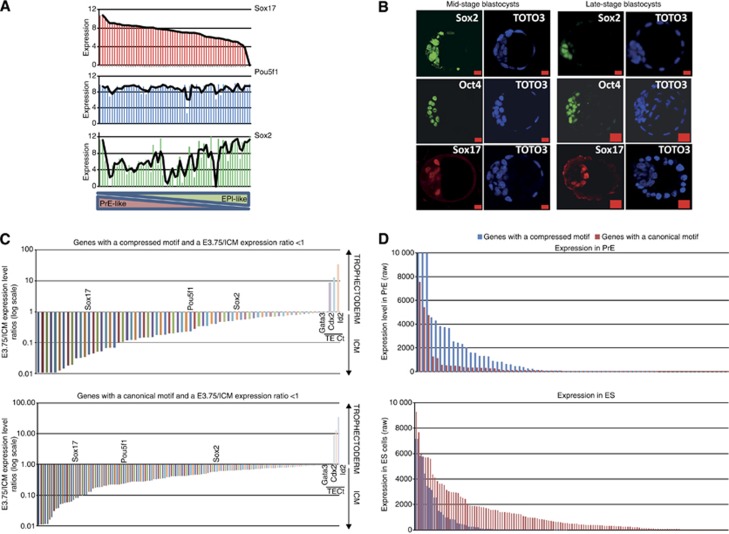
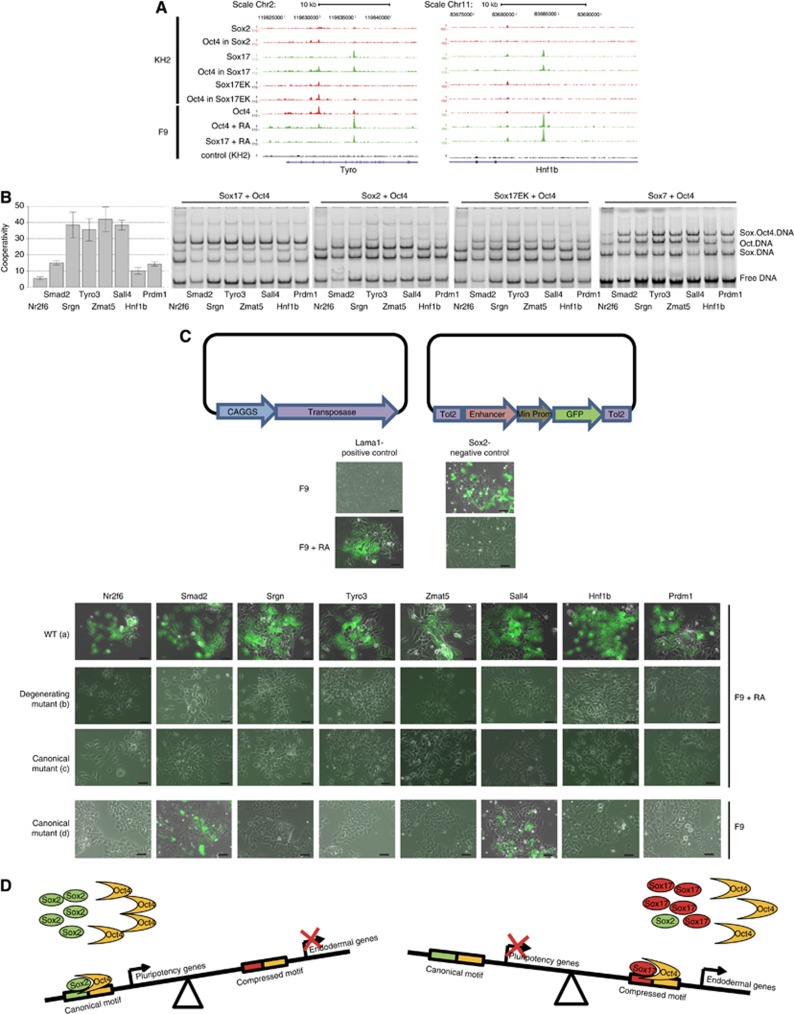
How regulatory information is encoded in the genome is poorly understood and poses a challenge when studying biological processes. We demonstrate here that genomic redistribution of Oct4 by alternative partnering with Sox2 and Sox17 is a fundamental regulatory event of endodermal specification. We show that Sox17 partners with Oct4 and binds to a unique 'compressed' Sox/Oct motif that earmarks endodermal genes. This is in contrast to the pluripotent state where Oct4 selectively partners with Sox2 at 'canonical' binding sites. The distinct selection of binding sites by alternative Sox/Oct partnering is underscored by our demonstration that rationally point-mutated Sox17 partners with Oct4 on pluripotency genes earmarked by the canonical Sox/Oct motif. In an endodermal differentiation assay, we demonstrate that the compressed motif is required for proper expression of endodermal genes. Evidently, Oct4 drives alternative developmental programs by switching Sox partners that affects enhancer selection, leading to either an endodermal or pluripotent cell fate. This work provides insights in understanding cell fate transcriptional regulation by highlighting the direct link between the DNA sequence of an enhancer and a developmental outcome.


Conflict of interest statement

The authors declare that they have no conflict of interest.

Figures

Figure 1
Figure 1
Induced expression of Sox2 and Sox17 in ESC lines. (A) Schematic of the KH2-inducible vector system used to conditionally express epitoge (V5)-tagged Sox proteins in ESCs (FRT (Flipase Recognition Target), pA (Polyadenylation signal), tetO (tetracycline/doxycycline Operator)). (B) Anti-V5 western blot showing the expression of the V5-tagged Sox2 and Sox17 proteins in two independent cell clones treated with (+) or without (−) doxycycline for 48 h. (C) Quantitative RT–PCR of Nanog, Oct4, Gata4 and Lama1 in Sox2- and Sox17-inducible ESCs treated with doxycycline for 48 h in two independent clones. (D) Western blot of Sox17-V5, Oct4 and Sox2 in two Sox17-V5 expressing ESC lines and its quantification for Oct4 and Sox2. Proteins were (i) first incubated with the V5 and the Oct4 antibodies (upper panel), (ii) then the membrane was reprobed with the V5 and Sox2 antibodies (middle panel) and (iii) finally with the β-actin antibody (lower panel).
Figure 2
Figure 2
Sox2/Oct4 and Sox17/Oct4 pairs are recruited at different genomic loci. (A) Oct4 is redistributed to different genomic loci by Sox factors. Co-occurrence of Sox2 or Sox17 with Oct4 in either Sox2-V5 or Sox17-V5 expressing KH2 cells. (a, b) Marks the intersect set of peaks used for de novo motif searching. Sox2 is more likely to co-occur with Oct4 ChiPed in a Sox2 OE background than with Oct4 ChIPed in a Sox17 OE background (P-value 5.1e−91, Z-score test). Inversely, Sox17 predominantly co-occurs on sites also bound by Oct4 ChIPed in Sox17 OE background whereas co-binding with Oct4 ChIPed in a Sox2 OE background much less likely (P-value 5.0e–116, Z-score test). (B) Matrices predicted by de novo motif analysis in (a) Sox2/Oct4Sox2 and (b) Sox17/Oct4Sox17 intersects. (C, D) Fraction of canonical, compressed, both (overlapping) and absence of motifs within (C) Sox2/Oct4Sox2 or (D) Sox17/Oct4Sox17 co-bound loci. (EH) Motif counts binned by distances of the actual motif coordinate to the summit of the ChIP-seq peak for the canonical and compressed motifs in Sox2/Oct4Sox2 sites and Sox17/Oct4Sox17 sites. (I, J) Genome distribution of canonical motifs found in Sox2/Oct4Sox2 sites and compressed motifs in Sox17/Oct4Sox17 sites with respect to transcription start sites (TSS). (K) Fraction of Sox2/Oct4Sox2 bound canonical motifs in Sox2-V5 KH2 cells and Sox17/Oct4Sox17 bound compressed motifs in Sox17-V5 KH2 cells overlapping with H3K4m1 (enhancer mark), H3K4me3 (promoter mark), p300, PolII and CTCF regions annotated by ChIP-seq for Bruce4 mouse ESC by the ENCODE consortium. (L) The subset of overlapped Oct4Sox2 and Sox2 peaks with a motif is significantly higher than the total of Oct4Sox2 or Sox2 peaks (P-values 5.0e–209 and P<e–200; Wilcoxon rank sum test). (M) Similarly, the subset of peaks co-bound by Sox17/Oct4Sox17 containing a compressed motif is significantly higher than the total of Oct4Sox17 and Sox17 peaks (P-values 2.9e–93 and 1.2e–79; Wilcoxon rank sum test). Solid bars of boxes display the 25th–75th percentile of the peaks with the median indicated as an intersection. The box plots are shown on a logarithmic scale.
Figure 3
Figure 3
Canonical and compressed motifs regulate different sets of genes. (A, B) The 30-Way PhastCons scores of 20 placental mammals tracks downloaded from the UCSC Table Browser were ascertained, using a window extended ±1000, bp from the centre of each motif, for 2269 canonical motifs in Sox2-V5 KH2 cells (A) and 523 compressed motifs in Sox17-V5 KH2 cells (B). (C, D) Microaray probes from KH2 cells expressing Sox17-V5 were ranked from most upregulated (red) to downregulated (blue) and the presence of a canonical or compressed motif was scored if found within 50 kb of the TSS of the gene (black horizontal bars indicate the presence of the motif). The density of compressed motif and canonical motif was measured using a sliding window comprising 10% of the total number of microarray probes. Presence of a motif gives the gene a value of 1 and absence of the motif the value 0. A sliding window is then used to calculate a density plot, black dotted line is the mean, and the two red dotted lines are one standard deviation away from the mean. (E, F) GREAT (great.stanford.edu) gene ontology analysis for 2269 canonical motifs bound by Sox2 and Oct4Sox2 (E) or 523 compressed motifs bound by Sox17 and Oct4Sox17 (F). Top 20 Mouse Genome Information (MGI) expression ontology terms are shown ranked by binomial multiple testing corrected Q-values and colour coded according to the theiler stage.
Figure 4
Figure 4
Reengineered Sox2KE and Sox17EK factors target different loci than their wild-type counterparts. (A) Position weight matrices (PWMs) of motifs found de novo in peaks marked co-bound by Sox17EK/Oct4Sox17EK or Sox2KE/Oct4Sox2KE revealing a canonical Sox/Oct motif and a single Sox site. (B, C) Fraction of Sox17EK/Oct4Sox17EK or Sox2KE/Oct4Sox2KE peaks containing compressed, canonical, or both motifs (‘overlapping’). The total numbers of overlapped Oct4 and Sox2KE/Sox17EK peaks are shown. (D) Comparison of peak heights for canonical motifs co-bound by Sox17EK/Oct4Sox17EK, Oct4Sox17EK or Sox17EK. Solid bars of boxes display the 25th–75th percentile of the peaks with the median indicated as an intersection. The subset peaks where Sox17EK/Oct4Sox17EK binds canonical motifs are significantly higher than the total of Oct4 peaks (P-value <1e–200, Wilcoxon rank sum test). (EH) Mean pile-up per million reads for both canonical and compressed data in Sox2, Sox17, Sox2KE and Sox17EK expressing KH2 cells. Middle and bottom rows show density maps. Rows were ranked by motif quality scores with the highest scoring motifs at the top. The top panels show the mean pile-up per million reads for both canonical and compressed data.
Figure 5
Figure 5
Oct4 expression is important for the differentiation of F9 cells into primitive endoderm (PrE). (A) Brightfield pictures of undifferentiated F9 cells and differentiated F9 cells after retinoic acid (RA) treatment for 72 h. Relative mRNA expression as determined by Q-RT–PCR for PrE markers (B) Sox17, Gata4, Gata6, FoxA2, Col4a2 and Cxcr4; and pluripotency markers (C) Oct4, Nanog and Sox2 in F9 cells treated with RA for 24–120 h and XEN cells. (D) Western blot of Oct4, Sox2 and Sox17 in F9 cells treated with RA for 1–4 days. (E) Oct4/Sox2 and Oct4/Sox17 co-immunoprecipations performed in untreated and RA-treated F9 cells. An Oct4 antibody was used for immunoprecipitation and western blot was done using Sox2 and Sox17 antibodies. (F) Brightfield photos of F9 cells transfected with Oct4, Nanog and Non-targeting control siRNAs and induced to differentiate at d1 after knock-down. Analysis of the expression levels of Oct4 Nanog, Sox17, Gata4 and Gata6 by Q-RT–PCR.
Figure 6
Figure 6
Oct4 and Sox17 co-bound the compressed motif in F9 cells induced to differentiate into primitive endoderm. (A) Fractional overlap of endogenous Sox17 binding sites in RA-treated F9 cells co-occupied with Oct4 either before (red circle) or after adding RA (yellow circle). Upon differentiation, Oct4 co-occupies significantly more sites with Sox17 than prior the RA addition (1987 versus 1133; P-value=1.9e−143; Z-score test) indicating that Sox17 and Oct4 are co-recruited to different genes. Importantly, many of these new genes are earmarked by compressed motifs as found by de novo motif searching. (B) Distribution of peak heights in F9 cells treated with RA for all Oct4 sites, all Sox17 sites, and overlapped Oct4 and Sox17 sites. Solid bars of boxes display the 25th–75th percentile of the peaks with the median indicated as an intersection. The box plots are shown in a logarithmic scale. The subset of peaks when Oct4 co-binds with Sox17 to compressed motifs comprises significantly higher cohort than the total of Oct4 peaks (P=2.3e−95, Wilcoxon rank sum test). (C) Mean pile-up per million for compressed motifs in Oct4, Oct4 RA and Sox17 RA. Bottom row shows density maps of ChIP-seq data. (D) Compressed motif correlation with microarray gene expression of Sox7/Sox17 double knocked-down F9 cells. Motifs were assigned to genes if they are found within 50 kb of a Refgene TSS and the motif density plot is generated as in Figure 3.
Figure 7
Figure 7
Oct4/Sox2 and Oct4/Sox17 complexes regulate specific genes in mouse embryos at the blastocyst stage. (A) Sox17, Sox2, Oct4, Nanog and Gata4 expression levels distribution across each cell of a 64-cell stage mouse embryo obtained by single-cell gene expression analysis (Guo et al, 2010). A background of Ct=28 was used to obtain an absolute expression level. (B) Immunostainings of Oct4 and Sox17 in mouse embryos at mid and late blastocyst stage. Scale bar is 20 μm. (C) Histogram plots representing E3.75 blastocyst versus ICM expression level ratios for genes harbouring a compressed or a canonical motif in their enhancer region. Expression levels were determined by RNA-seq in RPKM (reads per kilobase per million mapped reads). (D) Histogram plot of the raw expression levels of each genes in ES and PrE cells with a compressed or a canonical motif and an E3.75 blastocyst/ICM lower than 1.
Figure 8
Figure 8
Sox17 and Oct4 cooperatively bind on the compressed motif and regulate endodermal genes transcription. (A) Binding profiles of Sox factors and Oct4 in KH2 and F9 cells at Hnf1b and Tyro3 genomic loci are shown. (B) EMSAs were performed using recombinant, DNA binding domains of Sox17, Sox2, Sox17EK and Sox7 with Oct4 on eight different DNA elements containing the compressed motif. Co-operativity factors for Sox17/Oct4 were represented as bar plots with ±standard deviations error bars. (C) GFP reporter assay done on F9 cells treated (a–c) or not (d) with RA with Wild-type (a), Degenerating mutants (b) and Canonical mutants (c, d) enhancers cloned in the Tol2 vector (Kawakami, 2007) (scale is 50 μm). (D) Model describing the Sox2/Oct4 and Sox17/Oct4 partnerships in ESC. In undifferentiated ESC, where Oct4 and Sox2 expression levels are high, both factors cooperate and target specifically the canonical motif to regulate the expression of specific pluripotency genes. When the balance of Sox factors shifts in ES cells Oct4 switches from an interaction with Sox2 on canonical mofits towards an interaction with Sox17, and targets specific genes containing a compressed motif to trigger endodermal specification.

Comment in

References

    1. Artus J, Panthier JJ, Hadjantonakis AK (2010) A role for PDGF signaling in expansion of the extra-embryonic endoderm lineage of the mouse blastocyst. Development 137: 3361–3372 - PMC - PubMed
    1. Barbacci E, Reber M, Ott MO, Breillat C, Huetz F, Cereghini S (1999) Variant hepatocyte nuclear factor 1 is required for visceral endoderm specification. Development 126: 4795–4805 - PubMed
    1. Beard C, Hochedlinger K, Plath K, Wutz A, Jaenisch R (2006) Efficient method to generate single-copy transgenic mice by site-specific integration in embryonic stem cells. Genesis 44: 23–28 - PubMed
    1. Bergsland M, Ramskold D, Zaouter C, Klum S, Sandberg R, Muhr J (2011) Sequentially acting Sox transcription factors in neural lineage development. Genes Dev 25: 2453–2464 - PMC - PubMed
    1. Biggin MD (2011) Animal transcription networks as highly connected, quantitative continua. Dev Cell 21: 611–626 - PubMed

Publication types

MeSH terms