. 2013 Jul;9(7):1632-42.
doi: 10.1039/c3mb25539e. Epub 2013 Mar 11.

A study of Caenorhabditis elegans DAF-2 mutants by metabolomics and differential correlation networks

Affiliations

A study of Caenorhabditis elegans DAF-2 mutants by metabolomics and differential correlation networks

Cecilia Castro et al. Mol Biosyst. 2013 Jul.

Abstract

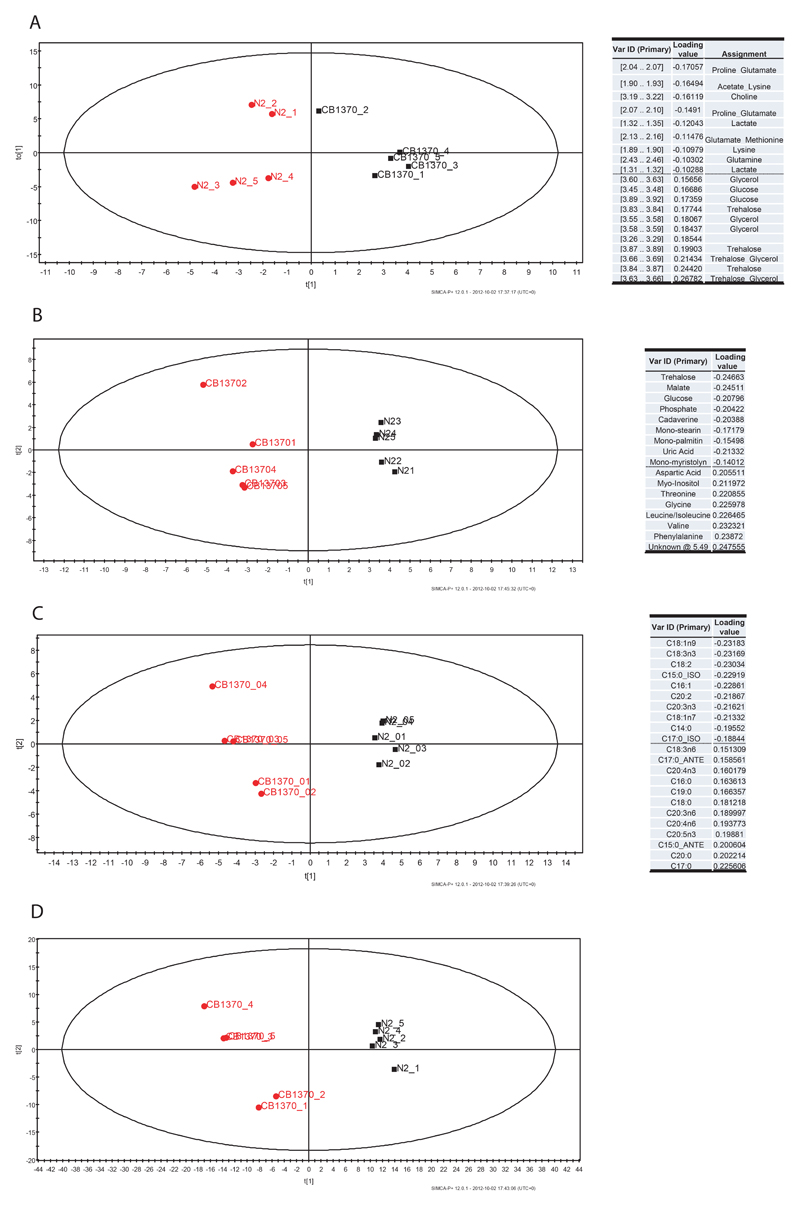
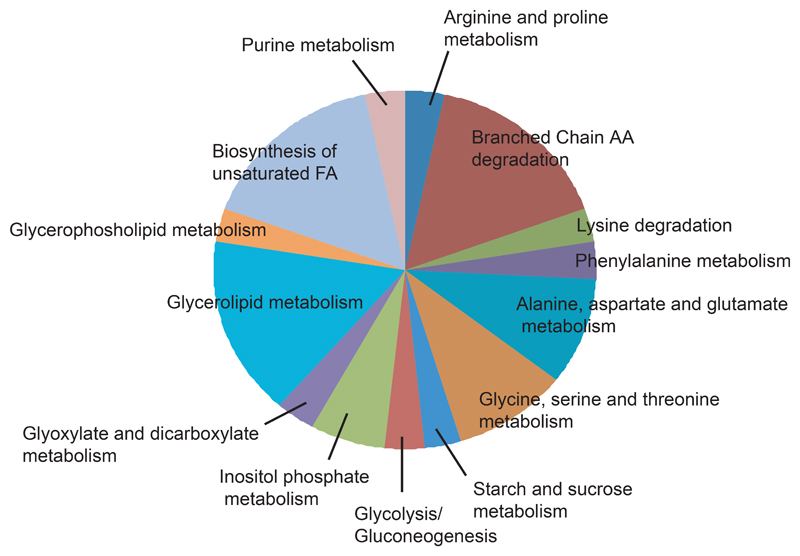
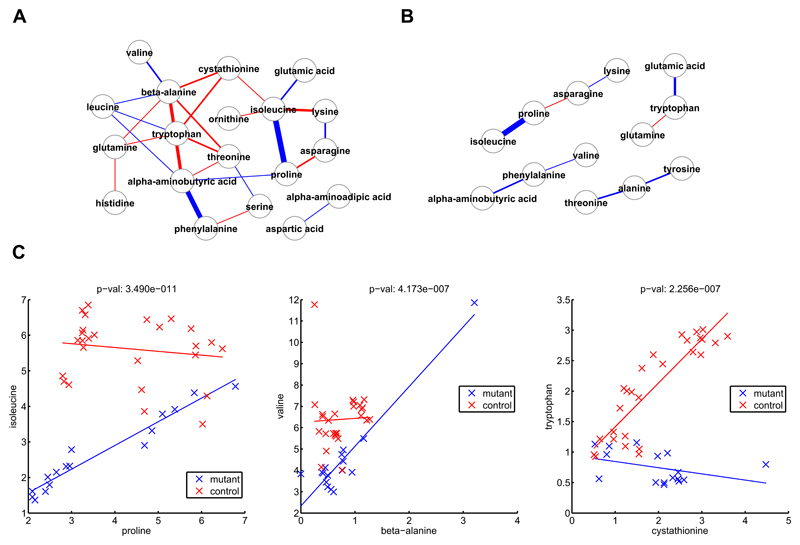
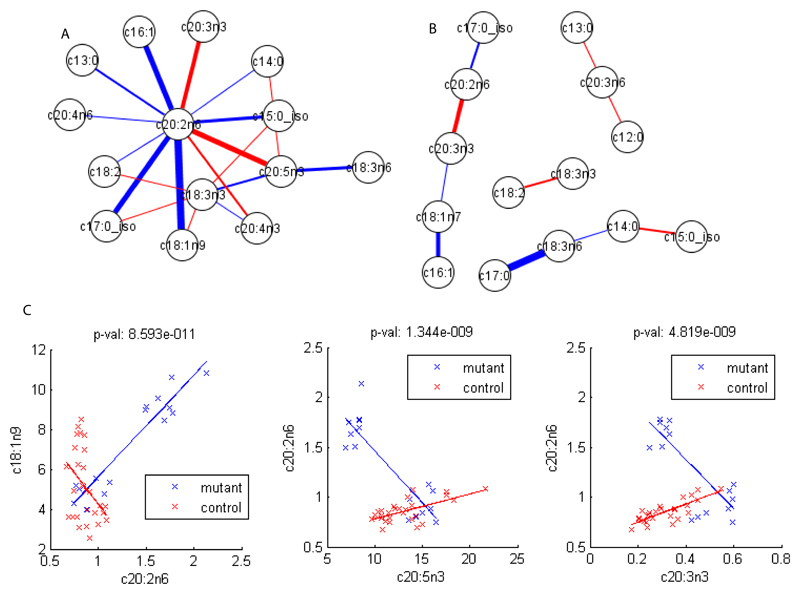
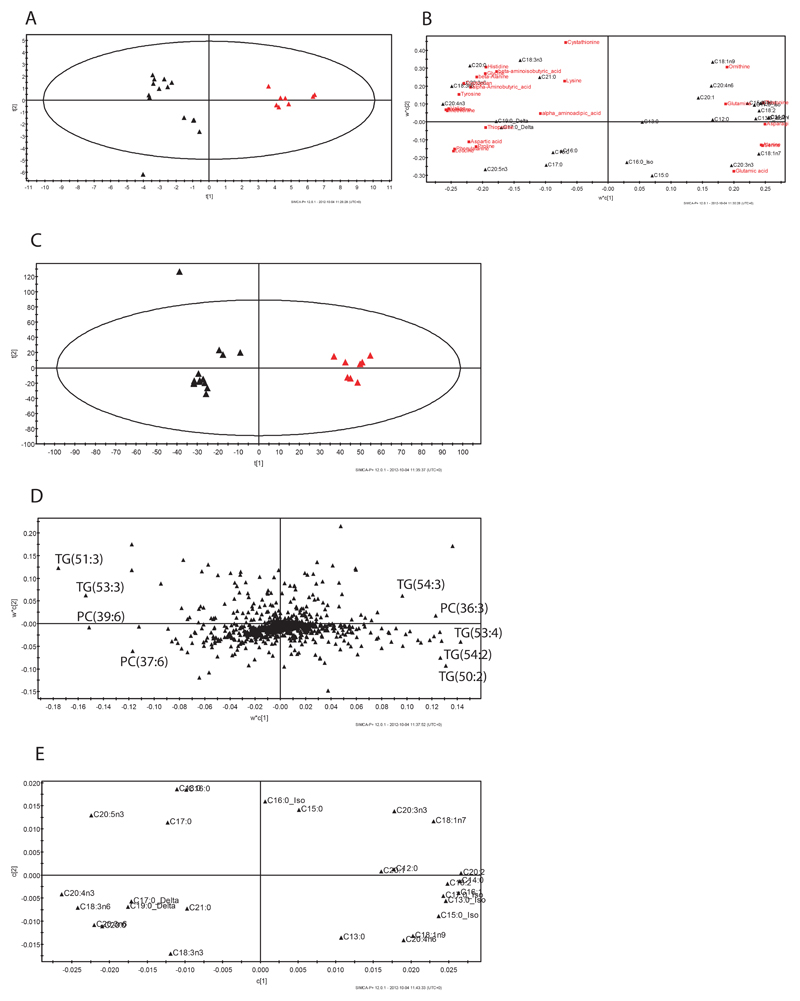
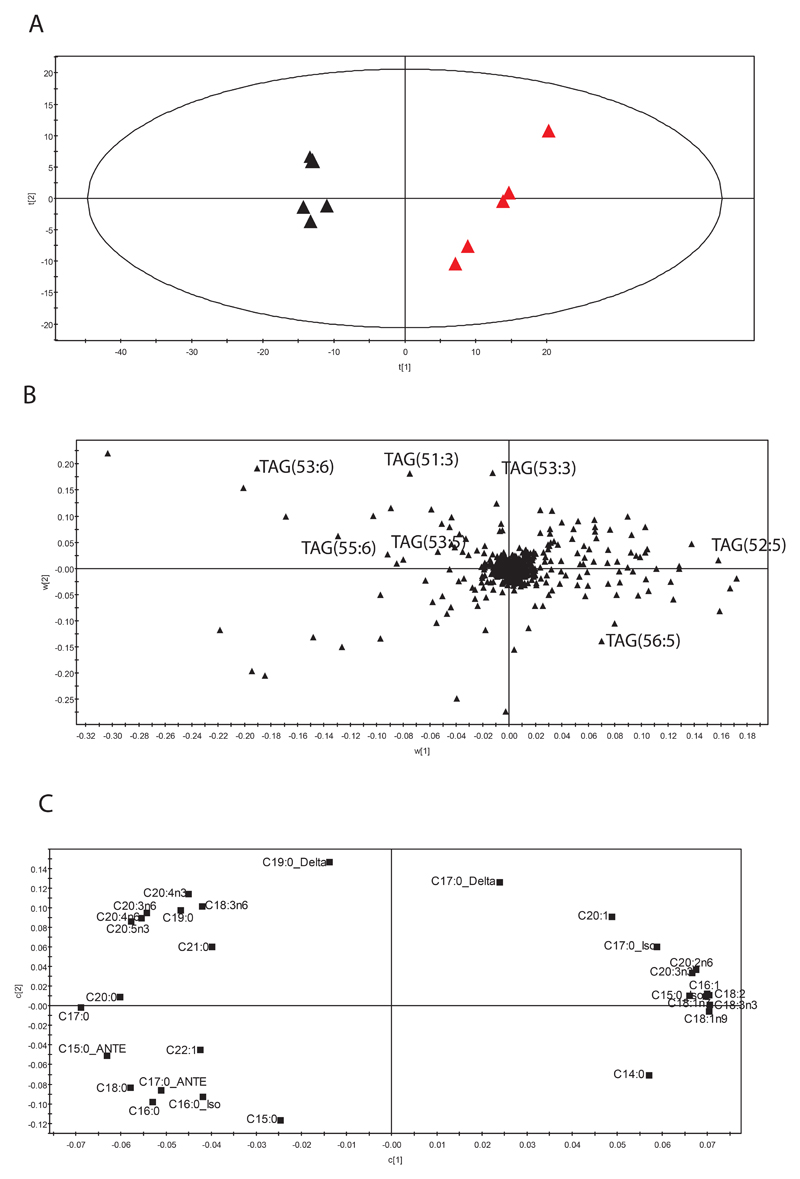
daf-2 is one of the most studied mutants in C. elegans: it contains a deletion in the gene orthologue of the insulin/insulin-like growth factor (IGF) receptor. Using high resolution (1)H NMR spectroscopy, metabolomics has helped to dissect the metabolic consequences of altered daf-2 signalling. Here, we present a detailed metabolomic analysis of daf-2, using NMR spectroscopy, gas chromatography mass spectrometry (GC-MS) and liquid chromatography mass spectrometry (LC-MS) to integrate information from different pathways. We have then used Pearson and partial correlation analysis to build networks to explore the central role of daf-2 in regulating fatty acid and amino acid metabolism. The results show the tight regulation between these two parts of the metabolome.


Figures

Figure 1
Figure 1
Metabolomic analysis of daf-2(e1370) mutants at 20°. Score plots and loading tables showing the clustering pattern according to genotype and the metabolites responsible for separation in the profiles obtained by A. NMR spectroscopy, B. aqueous fraction and GC-MS, C. fatty acids in GC-MS, D. LC-MS in positive mode.
Figure 2
Figure 2
Metabolic pathways changing for daf-2(e1370) mutants at 20°.
Figure 3
Figure 3
Correlation analysis for metabolites from the Amino Acid kit for daf-2(e1370) and the control at 25°. A. Differential network obtained considering Pearson correlation coefficients and a Bonferroni cut-off of 3.33e-5. Blue edges indicate a higher correlation in mutants, red a higher correlation in controls. B. Differential Gaussian graphical model obtained considering partial correlation coefficients. Again, blue edges indicate a higher correlation in mutants, red a higher correlation in controls. C. Biplots for Pearson correlation coefficients between couples of amino acids with significant changes between mutants and controls.
Figure 4
Figure 4
Correlation analysis for metabolites from the GC-MS for daf-2(e1370) and the control at 25°. A. Differential network obtained considering Pearson correlation coefficients and a Bonferroni cut-off of 2.64e-6. Blue edges indicate a higher correlation in mutants, red a higher correlation in controls. B. Differential Gaussian graphical model obtained considering partial correlation coefficients. Again, blue edges indicate a higher correlation in mutants, red a higher correlation in controls. C. Biplots for Pearson correlation coefficients between couples of fatty acids with significant changes between mutants and controls.
Figure 5
Figure 5
Multi-platform analysis for daf-2(e1370) and the control at 25°. A. Score plot of the PLS model obtained considering the fatty acids as X matrix and the amino acids as Y. Black triangles represent samples belonging to the control, red triangles samples belonging to the mutant strain. The subgroups among samples belonging to the same strain refers to “different days of bleaching”. B. Loading plot for the score in plot A shows the amino acids and fatty acids responsible for the model. C. Score plot of the PLS model obtained considering the lipids in positive mode as X matrix and the fatty acids as Y. Again, the black triangles represent samples belonging to the control, the red triangles samples belonging to the mutant strain. C. Loading plot associated to the X matrix for the score in C shows the lipids responsible for the model. D. Loading plot associated to the Y matrix for the score in C shows the fatty acids responsible for the model.
Figure 6
Figure 6
Multi-platform analysis for daf-2(e1370) and the control at 20°. A. Score plot of the PLS model obtained considering the lipids in positive mode as X matrix and the fatty acids as Y. Again, the black triangles represent samples belonging to the control, the red triangles samples belonging to the mutant strain. B. Loading plot associated to the X matrix for the score in A shows the lipids responsible for the model. C. Loading plot associated to the Y matrix for the score in A shows the fatty acids responsible for the model.

References

    1. The C. elegans sequencing consortium. Genome Sequence of the Nematode C. elegans: A Platform for Investigating Biology. Science. 1998;282:2012–2018. - PubMed
    1. Brenner S. The genetics of Caenorhabditis elegans. Genetics. 1974;77:71–94. - PMC - PubMed
    1. Ashrafi K, Chang FY, Watts JL, Fraser AG, Kamath RS, Ahringer J, Ruvkun G. Genome-wide RNAi analysis of Caenorhabditis elegans fat regulatory genes. Nature. 2003;421(6920):268–272. - PubMed
    1. Kenyon C, Chang J, Gensch E, Rudner A, Tabtiang R. A C. elegans mutant that lives twice as long as wild type. Nature. 1993;366:461–464. - PubMed
    1. Kimura KD, Tissenbaum HA, Liu Y, Ruvkun G. daf-2, an insulin receptor-like gene that regulates longevity and diapause in Caenorhabditis elegans. Science. 1997;277:942–946. - PubMed

MeSH terms

LinkOut - more resources